Evaluation Python / Machine Learning année 2017 - solution
Le répertoire _data/2017 contient deux fichiers csv simulés aléatoirement dont il faudra se servir pour répondre aux 10 questions qui suivent. Chaque question vaut deux points. Le travail est à rendre pour le lundi 20 février sous la forme d’un notebook envoyé en pièce jointe d’un mail.
[1]:
%matplotlib inline
1
Deux fichiers sont extraits de la base de données d’un médecin. Un fichier contient des informations sur des personnes, un autre sur les rendez-vous pris par ces personnes. Quels sont-ils ?
[3]:
import pandas

persons = pandas.read_csv(
    "https://raw.githubusercontent.com/sdpython/teachpyx/main/_data/2017/persons.txt",
    sep="\t",
)
persons.head()
[3]:
| age | gender | idc | name | |
|---|---|---|---|---|
| 0 | 37 | 0 | 4ba0b473-f8ca-4466-a65b-40e9b8ba5029 | Cendrillon |
| 1 | 41 | 0 | f44b004b-b01e-4835-b86d-1a42846c6d93 | Cendrillon |
| 2 | 46 | 1 | 304895f0-f686-4b0e-8854-a705bb5a6982 | Balthazar |
| 3 | 42 | 1 | 3f0d31d2-0ef4-4e7e-b876-07d10225cc8c | Balthazar |
| 4 | 41 | 1 | f29273f4-a76c-4158-b5f5-b3e5a080a0c7 | Balthazar |
[4]:
rend = pandas.read_csv(
    "https://raw.githubusercontent.com/sdpython/teachpyx/main/_data/2017/rendezvous.txt",
    sep="\t",
)
rend.head()
[4]:
| date | idc | idr | price | |
|---|---|---|---|---|
| 0 | 2016-12-02 19:47:45.068274 | 4ba0b473-f8ca-4466-a65b-40e9b8ba5029 | b7db0ac9-86a1-46f9-98ac-f1f8eb54072d | 75.0 |
| 1 | 2016-12-02 19:47:45.068274 | 4ba0b473-f8ca-4466-a65b-40e9b8ba5029 | a65f721a-de11-4a01-be71-b26e2da3ac00 | 65.0 |
| 2 | 2016-12-07 19:47:45.068274 | f44b004b-b01e-4835-b86d-1a42846c6d93 | 644b1236-b9ee-4ef5-8ca7-d1adadb547c8 | 75.0 |
| 3 | 2016-12-17 19:47:45.068274 | f44b004b-b01e-4835-b86d-1a42846c6d93 | aff6ac9e-5dd0-434e-9888-f724f6d40969 | 80.0 |
| 4 | 2017-01-07 19:47:45.068274 | f44b004b-b01e-4835-b86d-1a42846c6d93 | 9ca87507-aa95-49a9-88b3-86ec9fbc44d6 | 80.0 |
[5]:
persons.shape, rend.shape
[5]:
((1000, 4), (2537, 4))
Le second fichier est plus volumineux et contient une variable price qui ne peut pas être reliée aux personnes. Le premier fichier est celui des personnes, le second celui des rendez-vous. La variable idc est présente dans les deux tables. C’est elle qui identifie les personnes dans les deux tables.
2
On souhaite étudier la relation entre le prix moyen payé par une personne, son âge et son genre. Calculer le prix moyen payé par une personne ?
La table des rendez-vous contient toutes l’information nécessaire. La question était un peu ambiguë. On peut déterminer le prix moyen payé par personne, ou le prix moyen des prix moyens… On va répondre à la première option car la seconde n’a pas beaucoup d’intérêt et c’est très proche du prix moyen par rendez-vous, ce que la question aurait sans doute formulé dans ce sens si telle avait été son intention. On groupe par idc et on fait la moyenne.
[8]:
gr = rend[["idc", "price"]].groupby("idc").mean()
gr.head()
[8]:
| price | |
|---|---|
| idc | |
| 003b0195-2acb-4f46-b7fa-28cf266a8f60 | 80.0 |
| 009e689c-51a1-4cef-99ca-a4ba364eba8d | 80.0 |
| 00a213c2-1174-4359-8a67-fe710ec1b439 | 70.0 |
| 00e42818-aade-4758-a5f6-c78a6f235ea5 | 70.0 |
| 0153b785-9acd-4d28-aad1-62f8bf2faea3 | 75.0 |
3
Faire la jointure entre les deux tables.
[9]:
join = persons.merge(gr.reset_index(), on="idc")
join.head()
[9]:
| age | gender | idc | name | price | |
|---|---|---|---|---|---|
| 0 | 37 | 0 | 4ba0b473-f8ca-4466-a65b-40e9b8ba5029 | Cendrillon | 70.000000 |
| 1 | 41 | 0 | f44b004b-b01e-4835-b86d-1a42846c6d93 | Cendrillon | 78.333333 |
| 2 | 46 | 1 | 304895f0-f686-4b0e-8854-a705bb5a6982 | Balthazar | 75.000000 |
| 3 | 42 | 1 | 3f0d31d2-0ef4-4e7e-b876-07d10225cc8c | Balthazar | 95.000000 |
| 4 | 41 | 1 | f29273f4-a76c-4158-b5f5-b3e5a080a0c7 | Balthazar | 90.000000 |
Cette jointure est assez simple puisque la colonne partagée porte le même nom dans les deux tables. On peut néanmoins se poser la question de savoir s’il y a des personnes qui n’ont pas de rendez-vous associé et réciproquement.
[10]:
join.shape
[10]:
(1000, 5)
[11]:
join = persons.merge(gr.reset_index(), on="idc", how="outer")
join.shape
[11]:
(1000, 5)
Visiblement, ce n’est pas le cas puisqu’une jointure incluant les éléments sans correspondances dans les deux tables n’ajoute pas plus d’éléments à la jointure.
4
Tracer deux nuages de points (age, prix moyen) et (genre, prix moyen) ?
[13]:
join.plot(x="age", y="price", kind="scatter", title="age / price")
[13]:
<Axes: title={'center': 'age / price'}, xlabel='age', ylabel='price'>
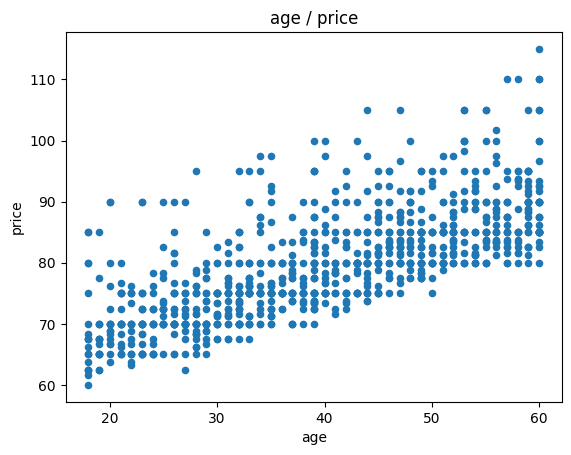
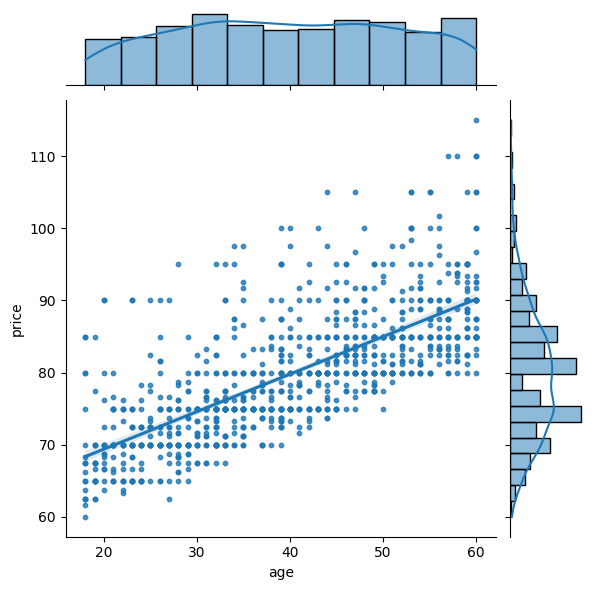
On peut aussi utiliser un module comme seaborn qui propose des dessins intéressants pour un statisticatien.
[16]:
import seaborn

g = seaborn.jointplot(join, x="age", y="price", kind="reg", scatter_kws={"s": 10})
~/.local/lib/python3.10/site-packages/seaborn/_oldcore.py:1119: FutureWarning: use_inf_as_na option is deprecated and will be removed in a future version. Convert inf values to NaN before operating instead.
  with pd.option_context('mode.use_inf_as_na', True):
~/.local/lib/python3.10/site-packages/seaborn/_oldcore.py:1119: FutureWarning: use_inf_as_na option is deprecated and will be removed in a future version. Convert inf values to NaN before operating instead.
  with pd.option_context('mode.use_inf_as_na', True):
[17]:
join.plot(x="gender", y="price", kind="scatter")
[17]:
<Axes: xlabel='gender', ylabel='price'>
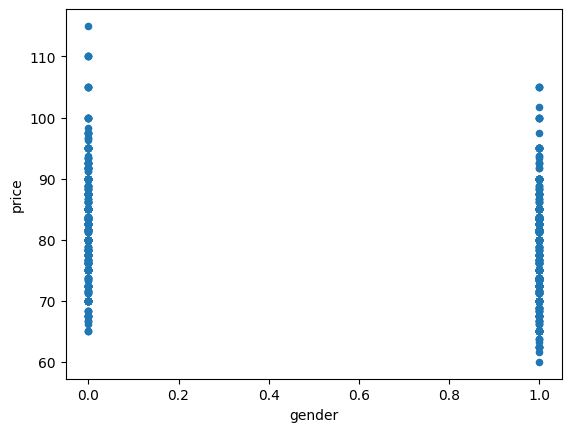
On ne voit pas grand chose sur ce second graphe. Une option est d’ajouter un bruit aléatoire sur le genre pour éclater le nuage.
[18]:
import numpy

bruit = join.copy()
bruit["gx"] = bruit.gender + numpy.random.random(bruit.shape[0]) / 3
bruit.plot(x="gx", y="price", kind="scatter")
[18]:
<Axes: xlabel='gx', ylabel='price'>
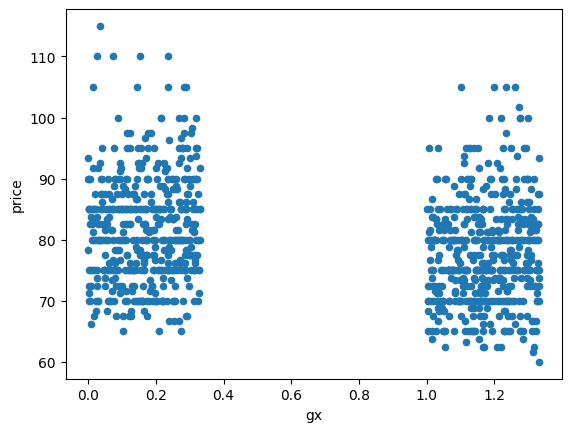
Il n’y a rien de flagrant. On peut faire un graphe moustache.
[19]:
join[["price", "gender"]].boxplot(by="gender")
[19]:
<Axes: title={'center': 'price'}, xlabel='[gender]'>
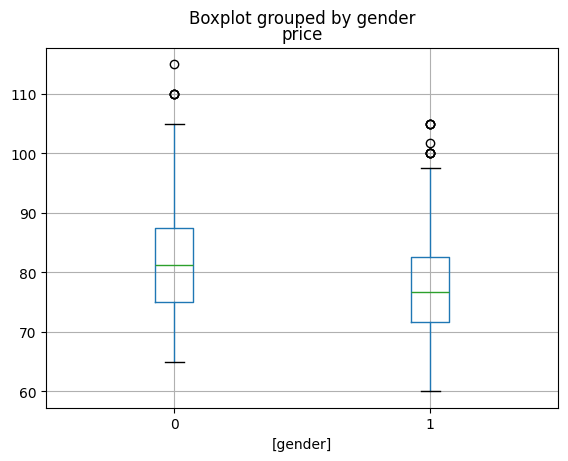
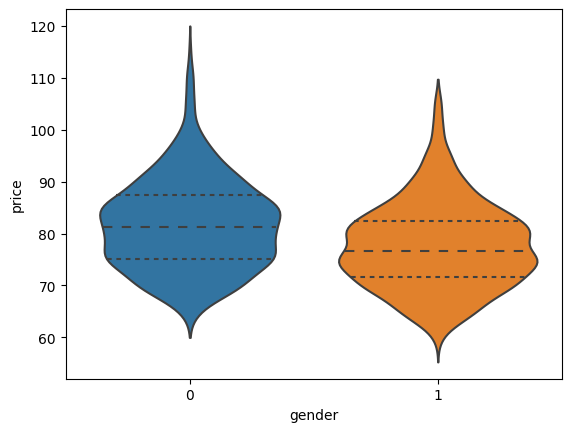
C’est mieux. Un dernier. Le diagramme violon, plus complet que le précédent.
[20]:
seaborn.violinplot(x="gender", y="price", data=join, inner="quart")
[20]:
<Axes: xlabel='gender', ylabel='price'>
5
Calculer les coefficients de la régression .
Une régression. Le premier réflexe est scikit-learn.
[22]:
from sklearn.linear_model import LinearRegression

lr = LinearRegression()
lr.fit(join[["age", "gender"]], join["price"])
[22]:
LinearRegression()In a Jupyter environment, please rerun this cell to show the HTML representation or trust the notebook.
On GitHub, the HTML representation is unable to render, please try loading this page with nbviewer.org.
LinearRegression()
[23]:
lr.coef_
[23]:
array([ 0.52440734, -4.36373925])
[24]:
lr.intercept_
[24]:
61.05057671902867
On utilise maintenant statsmodels qui est plus complet pour toute ce qui est un modèle linéaire.
[25]:
from statsmodels.formula.api import ols

lr = ols("price ~ age + gender", data=join)
res = lr.fit()
res.summary()
[25]:
| Dep. Variable: | price | R-squared: | 0.579 |
|---|---|---|---|
| Model: | OLS | Adj. R-squared: | 0.579 |
| Method: | Least Squares | F-statistic: | 686.6 |
| Date: | Thu, 25 Jan 2024 | Prob (F-statistic): | 3.25e-188 |
| Time: | 11:12:30 | Log-Likelihood: | -3149.8 |
| No. Observations: | 1000 | AIC: | 6306. |
| Df Residuals: | 997 | BIC: | 6320. |
| Df Model: | 2 | ||
| Covariance Type: | nonrobust |
| coef | std err | t | P>|t| | [0.025 | 0.975] | |
|---|---|---|---|---|---|---|
| Intercept | 61.0506 | 0.640 | 95.432 | 0.000 | 59.795 | 62.306 |
| age | 0.5244 | 0.015 | 35.302 | 0.000 | 0.495 | 0.554 |
| gender | -4.3637 | 0.358 | -12.194 | 0.000 | -5.066 | -3.662 |
| Omnibus: | 300.096 | Durbin-Watson: | 1.999 |
|---|---|---|---|
| Prob(Omnibus): | 0.000 | Jarque-Bera (JB): | 719.506 |
| Skew: | 1.618 | Prob(JB): | 5.77e-157 |
| Kurtosis: | 5.608 | Cond. No. | 151. |
Notes:
[1] Standard Errors assume that the covariance matrix of the errors is correctly specified.
Ou encore (après avoir ajouté une constante).
[26]:
from statsmodels.api import OLS

join2 = join.copy()
join2["cst"] = 1
lr = OLS(join2["price"], join2[["age", "gender", "cst"]])
res = lr.fit()
res.summary()
[26]:
| Dep. Variable: | price | R-squared: | 0.579 |
|---|---|---|---|
| Model: | OLS | Adj. R-squared: | 0.579 |
| Method: | Least Squares | F-statistic: | 686.6 |
| Date: | Thu, 25 Jan 2024 | Prob (F-statistic): | 3.25e-188 |
| Time: | 11:12:33 | Log-Likelihood: | -3149.8 |
| No. Observations: | 1000 | AIC: | 6306. |
| Df Residuals: | 997 | BIC: | 6320. |
| Df Model: | 2 | ||
| Covariance Type: | nonrobust |
| coef | std err | t | P>|t| | [0.025 | 0.975] | |
|---|---|---|---|---|---|---|
| age | 0.5244 | 0.015 | 35.302 | 0.000 | 0.495 | 0.554 |
| gender | -4.3637 | 0.358 | -12.194 | 0.000 | -5.066 | -3.662 |
| cst | 61.0506 | 0.640 | 95.432 | 0.000 | 59.795 | 62.306 |
| Omnibus: | 300.096 | Durbin-Watson: | 1.999 |
|---|---|---|---|
| Prob(Omnibus): | 0.000 | Jarque-Bera (JB): | 719.506 |
| Skew: | 1.618 | Prob(JB): | 5.77e-157 |
| Kurtosis: | 5.608 | Cond. No. | 151. |
Notes:
[1] Standard Errors assume that the covariance matrix of the errors is correctly specified.
On peut aussi définir la régression sous la forme de formule avec le module patsy.
[27]:
from patsy import dmatrices

y, X = dmatrices("price ~ age + gender", join, return_type="matrix")
y = numpy.ravel(y)
lr = LinearRegression(fit_intercept=False)
lr.fit(X, y)
[27]:
LinearRegression(fit_intercept=False)In a Jupyter environment, please rerun this cell to show the HTML representation or trust the notebook.
On GitHub, the HTML representation is unable to render, please try loading this page with nbviewer.org.
LinearRegression(fit_intercept=False)
[28]:
lr.coef_, lr.intercept_
[28]:
(array([61.05057672, 0.52440734, -4.36373925]), 0.0)
[29]:
X[:2]
[29]:
array([[ 1., 37.,  0.],
       [ 1., 41.,  0.]])
6
On souhaite étudier le prix d’une consultation en fonction du jour de la semaine. Ajouter une colonne dans la table de votre choix avec le jour de la semaine.
On convertit d’abord la colonne date (chaîne de caractères au format date) avec la fonction to_datetime.
[30]:
rend["date2"] = pandas.to_datetime(rend.date)
rend.dtypes
[30]:
date             object
idc              object
idr              object
price           float64
date2    datetime64[ns]
dtype: object
Et on récupère le jour de la semaine avec weekday.
[31]:
rend["weekday"] = rend.date2.dt.weekday
rend.head()
[31]:
| date | idc | idr | price | date2 | weekday | |
|---|---|---|---|---|---|---|
| 0 | 2016-12-02 19:47:45.068274 | 4ba0b473-f8ca-4466-a65b-40e9b8ba5029 | b7db0ac9-86a1-46f9-98ac-f1f8eb54072d | 75.0 | 2016-12-02 19:47:45.068274 | 4 |
| 1 | 2016-12-02 19:47:45.068274 | 4ba0b473-f8ca-4466-a65b-40e9b8ba5029 | a65f721a-de11-4a01-be71-b26e2da3ac00 | 65.0 | 2016-12-02 19:47:45.068274 | 4 |
| 2 | 2016-12-07 19:47:45.068274 | f44b004b-b01e-4835-b86d-1a42846c6d93 | 644b1236-b9ee-4ef5-8ca7-d1adadb547c8 | 75.0 | 2016-12-07 19:47:45.068274 | 2 |
| 3 | 2016-12-17 19:47:45.068274 | f44b004b-b01e-4835-b86d-1a42846c6d93 | aff6ac9e-5dd0-434e-9888-f724f6d40969 | 80.0 | 2016-12-17 19:47:45.068274 | 5 |
| 4 | 2017-01-07 19:47:45.068274 | f44b004b-b01e-4835-b86d-1a42846c6d93 | 9ca87507-aa95-49a9-88b3-86ec9fbc44d6 | 80.0 | 2017-01-07 19:47:45.068274 | 5 |
7
Créer un graphe moustache qui permet de vérifier cette hypothèse.
On réutilise le code d’une question précédente.
[32]:
rend[["price", "weekday"]].boxplot(by="weekday")
[32]:
<Axes: title={'center': 'price'}, xlabel='[weekday]'>
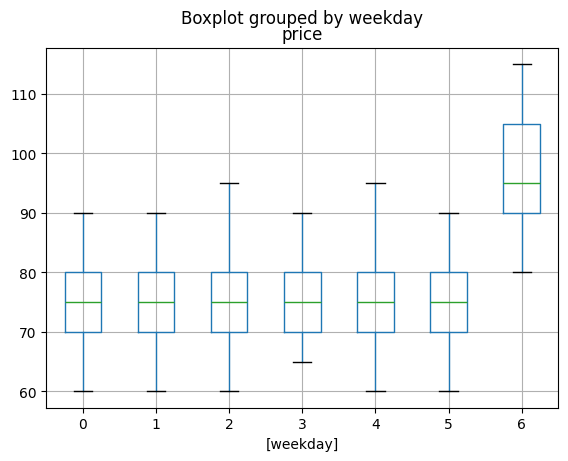
C’est clairement plus cher le dimanche.
8
Ajouter une colonne dans la table de votre choix qui contient 365 si c’est le premier rendez-vous, le nombre de jour écoulés depuis le précédent rendez-vous. On appelle cette colonne :math:`delay`. On ajoute également la colonne .
Pour commencer, on convertit la date en nombre de jours depuis la première date.
[33]:
rend["constant"] = rend["date2"].min()
rend["jour"] = rend["date2"] - rend["constant"]
rend.head(n=2)
[33]:
| date | idc | idr | price | date2 | weekday | constant | jour | |
|---|---|---|---|---|---|---|---|---|
| 0 | 2016-12-02 19:47:45.068274 | 4ba0b473-f8ca-4466-a65b-40e9b8ba5029 | b7db0ac9-86a1-46f9-98ac-f1f8eb54072d | 75.0 | 2016-12-02 19:47:45.068274 | 4 | 2016-11-18 19:47:45.068274 | 14 days |
| 1 | 2016-12-02 19:47:45.068274 | 4ba0b473-f8ca-4466-a65b-40e9b8ba5029 | a65f721a-de11-4a01-be71-b26e2da3ac00 | 65.0 | 2016-12-02 19:47:45.068274 | 4 | 2016-11-18 19:47:45.068274 | 14 days |
On convertit en entier.
[34]:
rend["jouri"] = rend.jour.apply(lambda d: d.days)
rend.head(n=2)
[34]:
| date | idc | idr | price | date2 | weekday | constant | jour | jouri | |
|---|---|---|---|---|---|---|---|---|---|
| 0 | 2016-12-02 19:47:45.068274 | 4ba0b473-f8ca-4466-a65b-40e9b8ba5029 | b7db0ac9-86a1-46f9-98ac-f1f8eb54072d | 75.0 | 2016-12-02 19:47:45.068274 | 4 | 2016-11-18 19:47:45.068274 | 14 days | 14 |
| 1 | 2016-12-02 19:47:45.068274 | 4ba0b473-f8ca-4466-a65b-40e9b8ba5029 | a65f721a-de11-4a01-be71-b26e2da3ac00 | 65.0 | 2016-12-02 19:47:45.068274 | 4 | 2016-11-18 19:47:45.068274 | 14 days | 14 |
On trie par patient et jour puis on effectue la différence.
[35]:
diff = rend.sort_values(["idc", "jouri"])["jouri"].diff()
rend["diff"] = diff
rend.head(n=2)
[35]:
| date | idc | idr | price | date2 | weekday | constant | jour | jouri | diff | |
|---|---|---|---|---|---|---|---|---|---|---|
| 0 | 2016-12-02 19:47:45.068274 | 4ba0b473-f8ca-4466-a65b-40e9b8ba5029 | b7db0ac9-86a1-46f9-98ac-f1f8eb54072d | 75.0 | 2016-12-02 19:47:45.068274 | 4 | 2016-11-18 19:47:45.068274 | 14 days | 14 | -26.0 |
| 1 | 2016-12-02 19:47:45.068274 | 4ba0b473-f8ca-4466-a65b-40e9b8ba5029 | a65f721a-de11-4a01-be71-b26e2da3ac00 | 65.0 | 2016-12-02 19:47:45.068274 | 4 | 2016-11-18 19:47:45.068274 | 14 days | 14 | 0.0 |
Il reste à traiter le premier jour ou plutôt le premier rendez-vous. On le récupère pour chaque patient.
[36]:
first = rend[["idc", "date"]].groupby("idc", as_index=False).min()
first["j365"] = 365
first.head(n=2)
[36]:
| idc | date | j365 | |
|---|---|---|---|
| 0 | 003b0195-2acb-4f46-b7fa-28cf266a8f60 | 2016-12-02 19:47:45.068274 | 365 |
| 1 | 009e689c-51a1-4cef-99ca-a4ba364eba8d | 2016-11-26 19:47:45.068274 | 365 |
Puis on fait une jointure.
[37]:
tout = rend.merge(first, on=["idc", "date"], how="outer")
tout[["idc", "jouri", "date", "j365"]].head(n=5)
[37]:
| idc | jouri | date | j365 | |
|---|---|---|---|---|
| 0 | 4ba0b473-f8ca-4466-a65b-40e9b8ba5029 | 14 | 2016-12-02 19:47:45.068274 | 365.0 |
| 1 | 4ba0b473-f8ca-4466-a65b-40e9b8ba5029 | 14 | 2016-12-02 19:47:45.068274 | 365.0 |
| 2 | f44b004b-b01e-4835-b86d-1a42846c6d93 | 19 | 2016-12-07 19:47:45.068274 | 365.0 |
| 3 | f44b004b-b01e-4835-b86d-1a42846c6d93 | 29 | 2016-12-17 19:47:45.068274 | NaN |
| 4 | f44b004b-b01e-4835-b86d-1a42846c6d93 | 50 | 2017-01-07 19:47:45.068274 | NaN |
Il ne reste plus qu’à remplacer les NaN par jouri.
[38]:
tout["delay"] = tout.j365.fillna(tout.jouri)
tout[["idc", "jouri", "date", "j365", "delay"]].head(n=8)
[38]:
| idc | jouri | date | j365 | delay | |
|---|---|---|---|---|---|
| 0 | 4ba0b473-f8ca-4466-a65b-40e9b8ba5029 | 14 | 2016-12-02 19:47:45.068274 | 365.0 | 365.0 |
| 1 | 4ba0b473-f8ca-4466-a65b-40e9b8ba5029 | 14 | 2016-12-02 19:47:45.068274 | 365.0 | 365.0 |
| 2 | f44b004b-b01e-4835-b86d-1a42846c6d93 | 19 | 2016-12-07 19:47:45.068274 | 365.0 | 365.0 |
| 3 | f44b004b-b01e-4835-b86d-1a42846c6d93 | 29 | 2016-12-17 19:47:45.068274 | NaN | 29.0 |
| 4 | f44b004b-b01e-4835-b86d-1a42846c6d93 | 50 | 2017-01-07 19:47:45.068274 | NaN | 50.0 |
| 5 | 304895f0-f686-4b0e-8854-a705bb5a6982 | 1 | 2016-11-19 19:47:45.068274 | 365.0 | 365.0 |
| 6 | 3f0d31d2-0ef4-4e7e-b876-07d10225cc8c | 30 | 2016-12-18 19:47:45.068274 | 365.0 | 365.0 |
| 7 | f29273f4-a76c-4158-b5f5-b3e5a080a0c7 | 2 | 2016-11-20 19:47:45.068274 | 365.0 | 365.0 |
Finalement, il faut ajouter une colonne . Comme des patients ont parfois deux rendez-vous le même jour, pour éviter les valeurs nulles, on ajoute la colonne
. On aurait pu également pour éviter les valeurs nulles considérer le temps en secondes et non en jour entre deux rendez-vous.
[39]:
tout["delay1"] = 1 / (tout["delay"] + 1)
tout[["delay", "delay1"]].head()
[39]:
| delay | delay1 | |
|---|---|---|
| 0 | 365.0 | 0.002732 |
| 1 | 365.0 | 0.002732 |
| 2 | 365.0 | 0.002732 |
| 3 | 29.0 | 0.033333 |
| 4 | 50.0 | 0.019608 |
8 - réponse plus courte
On garde l’idée de la fonction diff et on ajoute la fonction shift.
[40]:
rend2 = rend.sort_values(["idc", "jouri"]).reset_index(drop=True).copy()
rend2["diff"] = rend2["jouri"].diff()
rend2.loc[rend2.idc != rend2.idc.shift(1), "diff"] = 365
rend2.head()
[40]:
| date | idc | idr | price | date2 | weekday | constant | jour | jouri | diff | |
|---|---|---|---|---|---|---|---|---|---|---|
| 0 | 2016-12-02 19:47:45.068274 | 003b0195-2acb-4f46-b7fa-28cf266a8f60 | 6d65b2b5-f34d-4440-8442-679175554db4 | 80.0 | 2016-12-02 19:47:45.068274 | 4 | 2016-11-18 19:47:45.068274 | 14 days | 14 | 365.0 |
| 1 | 2016-11-26 19:47:45.068274 | 009e689c-51a1-4cef-99ca-a4ba364eba8d | 065474ed-6ba3-4ee1-aa83-b89e97d5a2aa | 80.0 | 2016-11-26 19:47:45.068274 | 5 | 2016-11-18 19:47:45.068274 | 8 days | 8 | 365.0 |
| 2 | 2016-12-20 19:47:45.068274 | 009e689c-51a1-4cef-99ca-a4ba364eba8d | 38a02a6a-8c04-4630-aaa6-2077077a9f87 | 80.0 | 2016-12-20 19:47:45.068274 | 1 | 2016-11-18 19:47:45.068274 | 32 days | 32 | 24.0 |
| 3 | 2017-01-12 19:47:45.068274 | 009e689c-51a1-4cef-99ca-a4ba364eba8d | f4cf0df4-0b6a-4b0f-93c7-d12499026fab | 80.0 | 2017-01-12 19:47:45.068274 | 3 | 2016-11-18 19:47:45.068274 | 55 days | 55 | 23.0 |
| 4 | 2016-12-02 19:47:45.068274 | 00a213c2-1174-4359-8a67-fe710ec1b439 | c1b3381b-9663-429d-a8fb-3b24c20a125b | 70.0 | 2016-12-02 19:47:45.068274 | 4 | 2016-11-18 19:47:45.068274 | 14 days | 14 | 365.0 |
9
Calculer les coefficients de la régression .
L’âge ne fait pas partie de la table tout. Il faut faire une jointure pour le récupérer.
[41]:
mat = tout.merge(persons, on="idc")
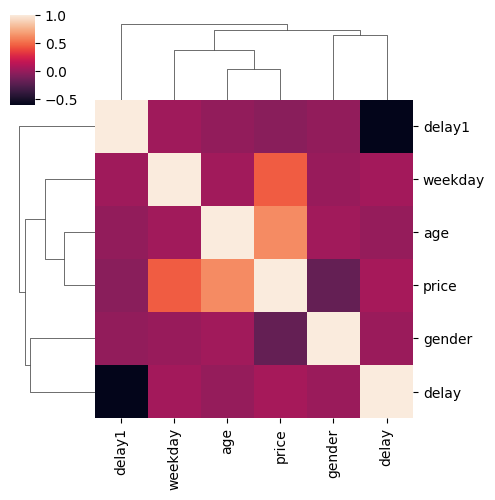
Ensuite retour à scikit-learn et plutôt le second statsmodels pour effectuer des tests sur les coefficients du modèle. On regarde d’abord les corrélations.
[42]:
mat[["age", "gender", "delay", "delay1", "weekday", "price"]].corr()
[42]:
| age | gender | delay | delay1 | weekday | price | |
|---|---|---|---|---|---|---|
| age | 1.000000 | 0.030852 | -0.010694 | -0.023011 | 0.032413 | 0.614708 |
| gender | 0.030852 | 1.000000 | 0.008700 | -0.026779 | -0.000064 | -0.198835 |
| delay | -0.010694 | 0.008700 | 1.000000 | -0.616038 | 0.039766 | 0.049796 |
| delay1 | -0.023011 | -0.026779 | -0.616038 | 1.000000 | 0.025400 | -0.054954 |
| weekday | 0.032413 | -0.000064 | 0.039766 | 0.025400 | 1.000000 | 0.448584 |
| price | 0.614708 | -0.198835 | 0.049796 | -0.054954 | 0.448584 | 1.000000 |
[43]:
seaborn.clustermap(
    mat[["age", "gender", "delay", "delay1", "weekday", "price"]].corr(), figsize=(5, 5)
)
[43]:
<seaborn.matrix.ClusterGrid at 0x7fb3214280d0>
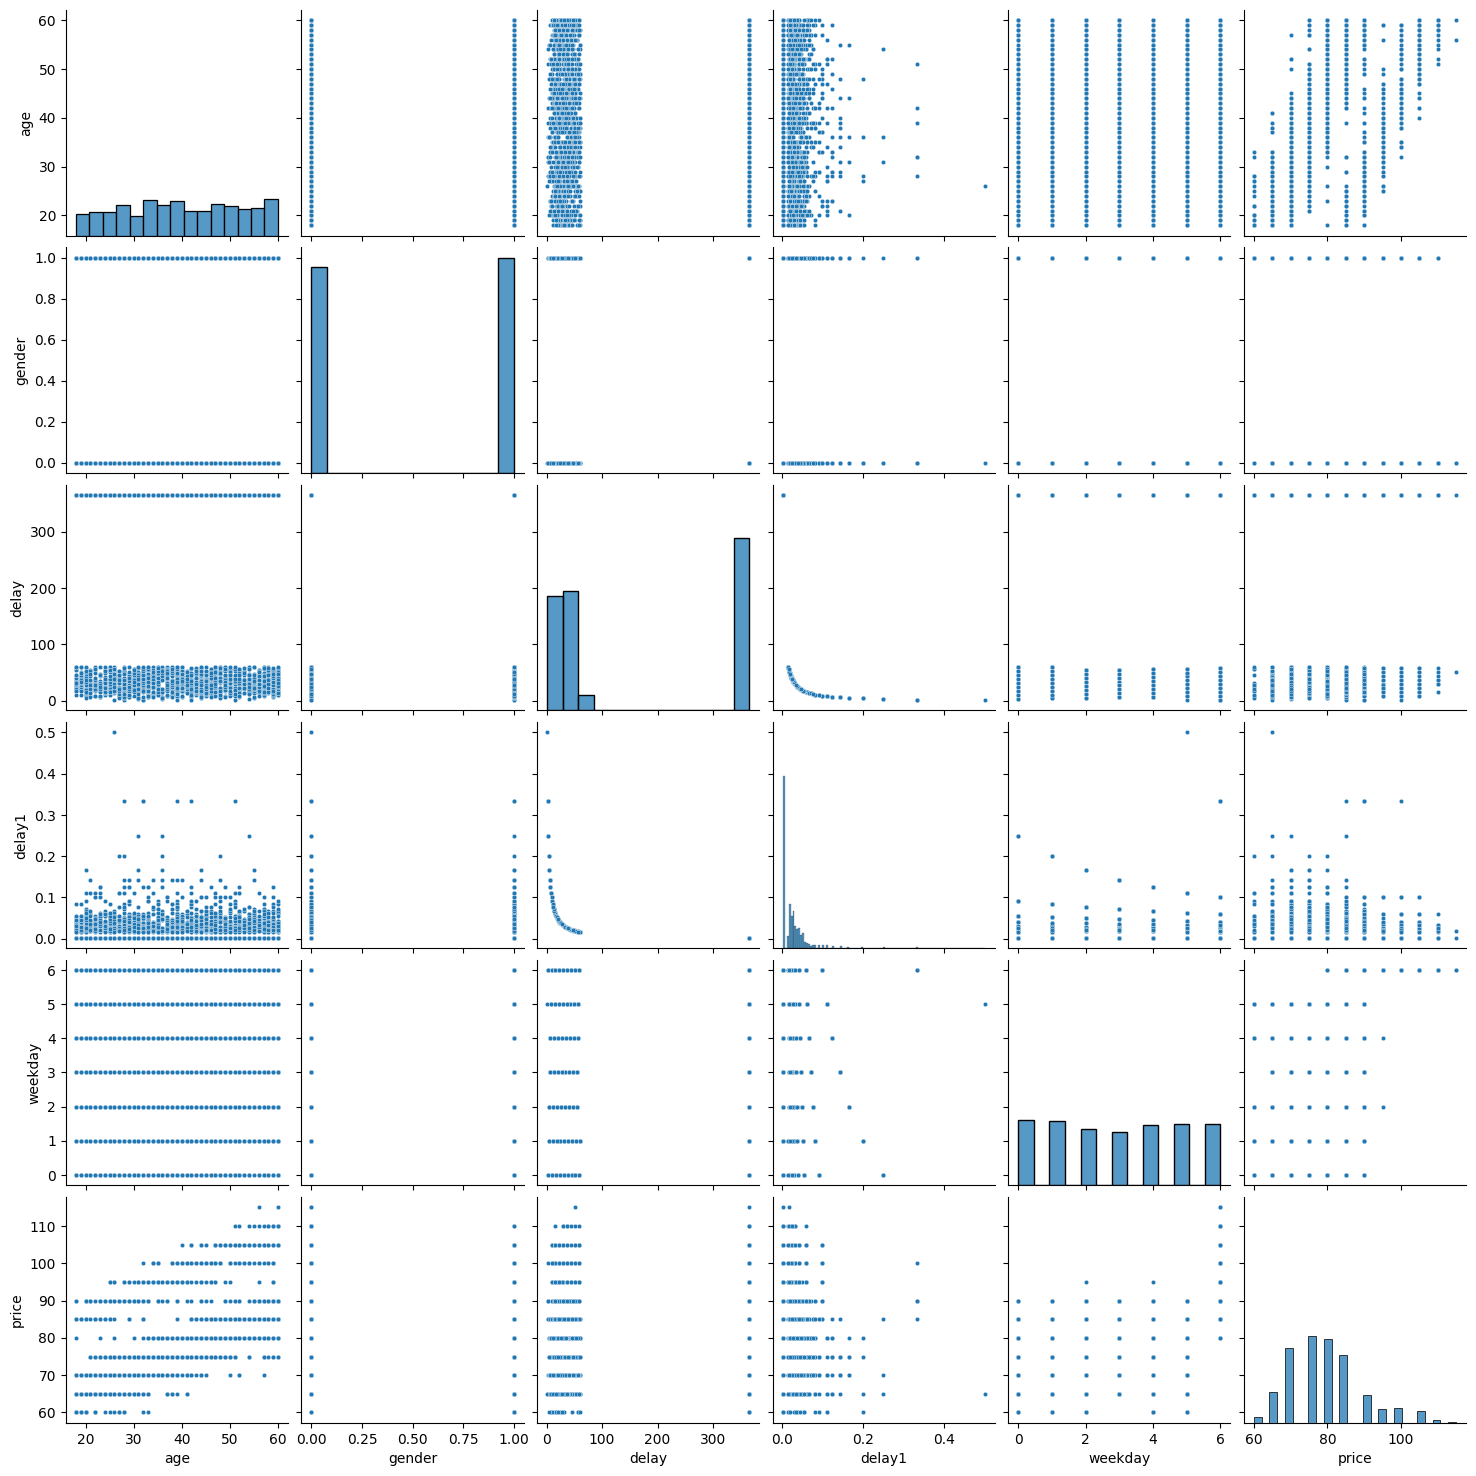
Si le jeu de données n’est pas trop volumineux.
[45]:
seaborn.pairplot(
    mat[["age", "gender", "delay", "delay1", "weekday", "price"]], plot_kws={"s": 10}
)
~/.local/lib/python3.10/site-packages/seaborn/_oldcore.py:1119: FutureWarning: use_inf_as_na option is deprecated and will be removed in a future version. Convert inf values to NaN before operating instead.
  with pd.option_context('mode.use_inf_as_na', True):
~/.local/lib/python3.10/site-packages/seaborn/_oldcore.py:1119: FutureWarning: use_inf_as_na option is deprecated and will be removed in a future version. Convert inf values to NaN before operating instead.
  with pd.option_context('mode.use_inf_as_na', True):
~/.local/lib/python3.10/site-packages/seaborn/_oldcore.py:1119: FutureWarning: use_inf_as_na option is deprecated and will be removed in a future version. Convert inf values to NaN before operating instead.
  with pd.option_context('mode.use_inf_as_na', True):
~/.local/lib/python3.10/site-packages/seaborn/_oldcore.py:1119: FutureWarning: use_inf_as_na option is deprecated and will be removed in a future version. Convert inf values to NaN before operating instead.
  with pd.option_context('mode.use_inf_as_na', True):
~/.local/lib/python3.10/site-packages/seaborn/_oldcore.py:1119: FutureWarning: use_inf_as_na option is deprecated and will be removed in a future version. Convert inf values to NaN before operating instead.
  with pd.option_context('mode.use_inf_as_na', True):
~/.local/lib/python3.10/site-packages/seaborn/_oldcore.py:1119: FutureWarning: use_inf_as_na option is deprecated and will be removed in a future version. Convert inf values to NaN before operating instead.
  with pd.option_context('mode.use_inf_as_na', True):
[45]:
<seaborn.axisgrid.PairGrid at 0x7fb3029bf820>
Un dernier pour la route.
[48]:
feat = mat[["age", "gender", "delay", "delay1", "weekday", "price"]]
g = seaborn.PairGrid(
    feat.sort_values("price", ascending=False),
    x_vars=feat.columns[:-1],
    y_vars=["price"],
)
g.map(seaborn.stripplot, size=3, orient="h", palette="Reds_r", edgecolor="gray")
~/.local/lib/python3.10/site-packages/seaborn/_oldcore.py:1119: FutureWarning: use_inf_as_na option is deprecated and will be removed in a future version. Convert inf values to NaN before operating instead.
  with pd.option_context('mode.use_inf_as_na', True):
~/.local/lib/python3.10/site-packages/seaborn/_oldcore.py:1119: FutureWarning: use_inf_as_na option is deprecated and will be removed in a future version. Convert inf values to NaN before operating instead.
  with pd.option_context('mode.use_inf_as_na', True):
~/.local/lib/python3.10/site-packages/seaborn/_oldcore.py:1119: FutureWarning: use_inf_as_na option is deprecated and will be removed in a future version. Convert inf values to NaN before operating instead.
  with pd.option_context('mode.use_inf_as_na', True):
~/.local/lib/python3.10/site-packages/seaborn/_oldcore.py:1119: FutureWarning: use_inf_as_na option is deprecated and will be removed in a future version. Convert inf values to NaN before operating instead.
  with pd.option_context('mode.use_inf_as_na', True):
~/.local/lib/python3.10/site-packages/seaborn/_oldcore.py:1119: FutureWarning: use_inf_as_na option is deprecated and will be removed in a future version. Convert inf values to NaN before operating instead.
  with pd.option_context('mode.use_inf_as_na', True):
~/.local/lib/python3.10/site-packages/seaborn/_oldcore.py:1119: FutureWarning: use_inf_as_na option is deprecated and will be removed in a future version. Convert inf values to NaN before operating instead.
  with pd.option_context('mode.use_inf_as_na', True):
~/.local/lib/python3.10/site-packages/seaborn/_oldcore.py:1119: FutureWarning: use_inf_as_na option is deprecated and will be removed in a future version. Convert inf values to NaN before operating instead.
  with pd.option_context('mode.use_inf_as_na', True):
~/.local/lib/python3.10/site-packages/seaborn/_oldcore.py:1119: FutureWarning: use_inf_as_na option is deprecated and will be removed in a future version. Convert inf values to NaN before operating instead.
  with pd.option_context('mode.use_inf_as_na', True):
~/.local/lib/python3.10/site-packages/seaborn/_oldcore.py:1119: FutureWarning: use_inf_as_na option is deprecated and will be removed in a future version. Convert inf values to NaN before operating instead.
  with pd.option_context('mode.use_inf_as_na', True):
~/.local/lib/python3.10/site-packages/seaborn/_oldcore.py:1119: FutureWarning: use_inf_as_na option is deprecated and will be removed in a future version. Convert inf values to NaN before operating instead.
  with pd.option_context('mode.use_inf_as_na', True):
[48]:
<seaborn.axisgrid.PairGrid at 0x7fb2fad7ac20>

Régression
[49]:
lr = LinearRegression()
lr.fit(mat[["age", "gender", "delay", "delay1", "weekday"]], mat["price"])
lr.coef_
[49]:
array([ 5.08109837e-01, -4.41245429e+00,  5.42852787e-04, -1.60797483e+01,
        2.12155016e+00])
[50]:
from statsmodels.formula.api import ols

lr = ols("price ~ age + gender + delay + delay1 + weekday", data=mat)
res = lr.fit()
res.summary()
[50]:
| Dep. Variable: | price | R-squared: | 0.612 |
|---|---|---|---|
| Model: | OLS | Adj. R-squared: | 0.612 |
| Method: | Least Squares | F-statistic: | 800.0 |
| Date: | Thu, 25 Jan 2024 | Prob (F-statistic): | 0.00 |
| Time: | 11:15:05 | Log-Likelihood: | -8257.2 |
| No. Observations: | 2537 | AIC: | 1.653e+04 |
| Df Residuals: | 2531 | BIC: | 1.656e+04 |
| Df Model: | 5 | ||
| Covariance Type: | nonrobust |
| coef | std err | t | P>|t| | [0.025 | 0.975] | |
|---|---|---|---|---|---|---|
| Intercept | 55.4146 | 0.545 | 101.618 | 0.000 | 54.345 | 56.484 |
| age | 0.5081 | 0.010 | 48.918 | 0.000 | 0.488 | 0.528 |
| gender | -4.4125 | 0.250 | -17.683 | 0.000 | -4.902 | -3.923 |
| delay | 0.0005 | 0.001 | 0.562 | 0.574 | -0.001 | 0.002 |
| delay1 | -16.0797 | 4.842 | -3.321 | 0.001 | -25.575 | -6.585 |
| weekday | 2.1216 | 0.061 | 34.623 | 0.000 | 2.001 | 2.242 |
| Omnibus: | 55.147 | Durbin-Watson: | 1.969 |
|---|---|---|---|
| Prob(Omnibus): | 0.000 | Jarque-Bera (JB): | 57.558 |
| Skew: | 0.358 | Prob(JB): | 3.17e-13 |
| Kurtosis: | 2.823 | Cond. No. | 9.20e+03 |
Notes:
[1] Standard Errors assume that the covariance matrix of the errors is correctly specified.
[2] The condition number is large, 9.2e+03. This might indicate that there are
strong multicollinearity or other numerical problems.
10
Comment comparer ce modèle avec le précédent ? Implémentez le calcul qui vous permet de répondre à cette question.
Nous pourrions comparer les coefficients (0.57, 0.61) des régressions pour savoir quelle est la meilleur excepté que celle-ci ne sont pas calculées sur les mêmes données. La comparaison n’a pas de sens et il serait dangeraux d’en tirer des conclusions. Les valeurs sont de plus très proches. Il faut comparer les prédictions. Dans le premier cas, on prédit le prix moyen. Dans le second, on prédit le prix d’une consultation. Il est alors possible de calculer une prédiction moyenne par
patient et de comparer les erreurs de prédiction du prix moyen. D’un côté, la prédiction du prix moyen, de l’autre la prédiction du prix d’une consultation agrégé par patient.
[51]:
lr_moy = LinearRegression()
lr_moy.fit(join[["age", "gender"]], join["price"])
lr_moy.coef_, lr_moy.intercept_
[51]:
(array([ 0.52440734, -4.36373925]), 61.05057671902867)
[52]:
pred_moy = lr_moy.predict(join[["age", "gender"]])
join["pred_moy"] = pred_moy
join.head()
[52]:
| age | gender | idc | name | price | pred_moy | |
|---|---|---|---|---|---|---|
| 0 | 37 | 0 | 4ba0b473-f8ca-4466-a65b-40e9b8ba5029 | Cendrillon | 70.000000 | 80.453648 |
| 1 | 41 | 0 | f44b004b-b01e-4835-b86d-1a42846c6d93 | Cendrillon | 78.333333 | 82.551278 |
| 2 | 46 | 1 | 304895f0-f686-4b0e-8854-a705bb5a6982 | Balthazar | 75.000000 | 80.809575 |
| 3 | 42 | 1 | 3f0d31d2-0ef4-4e7e-b876-07d10225cc8c | Balthazar | 95.000000 | 78.711946 |
| 4 | 41 | 1 | f29273f4-a76c-4158-b5f5-b3e5a080a0c7 | Balthazar | 90.000000 | 78.187538 |
On calcule l’erreur.
[53]:
err1 = ((join.pred_moy - join.price) ** 2).sum() / join.shape[0]
err1
[53]:
31.874448844571756
[54]:
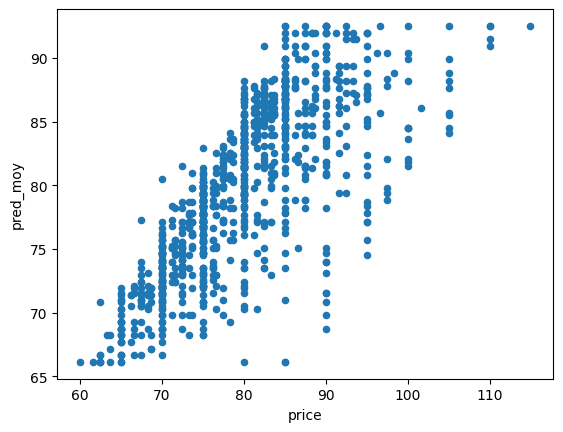
join.plot(x="price", y="pred_moy", kind="scatter")
[54]:
<Axes: xlabel='price', ylabel='pred_moy'>
[55]:
lrc = LinearRegression()
feat = mat[["age", "gender", "delay", "delay1", "weekday", "price", "idc"]].copy()
lrc.fit(feat[["age", "gender", "delay", "delay1", "weekday"]], feat["price"])
lrc.coef_, lrc.intercept_
[55]:
(array([ 5.08109837e-01, -4.41245429e+00,  5.42852787e-04, -1.60797483e+01,
         2.12155016e+00]),
 55.41460950333407)
[56]:
predc = lrc.predict(feat[["age", "gender", "delay", "delay1", "weekday"]])
feat["predc"] = predc
feat.head()
[56]:
| age | gender | delay | delay1 | weekday | price | idc | predc | |
|---|---|---|---|---|---|---|---|---|
| 0 | 37 | 0 | 365.0 | 0.002732 | 4 | 75.0 | 4ba0b473-f8ca-4466-a65b-40e9b8ba5029 | 82.855082 |
| 1 | 37 | 0 | 365.0 | 0.002732 | 4 | 65.0 | 4ba0b473-f8ca-4466-a65b-40e9b8ba5029 | 82.855082 |
| 2 | 41 | 0 | 365.0 | 0.002732 | 2 | 75.0 | f44b004b-b01e-4835-b86d-1a42846c6d93 | 80.644421 |
| 3 | 41 | 0 | 29.0 | 0.033333 | 5 | 80.0 | f44b004b-b01e-4835-b86d-1a42846c6d93 | 86.334615 |
| 4 | 41 | 0 | 50.0 | 0.019608 | 5 | 80.0 | f44b004b-b01e-4835-b86d-1a42846c6d93 | 86.566717 |
On agrège les secondes prédictions.
[57]:
agg = feat[["idc", "predc", "price"]].groupby("idc").mean()
agg.head()
[57]:
| predc | price | |
|---|---|---|
| idc | ||
| 003b0195-2acb-4f46-b7fa-28cf266a8f60 | 85.048055 | 80.0 |
| 009e689c-51a1-4cef-99ca-a4ba364eba8d | 83.945104 | 80.0 |
| 00a213c2-1174-4359-8a67-fe710ec1b439 | 72.345309 | 70.0 |
| 00e42818-aade-4758-a5f6-c78a6f235ea5 | 65.277461 | 70.0 |
| 0153b785-9acd-4d28-aad1-62f8bf2faea3 | 79.298313 | 75.0 |
[58]:
err2 = ((agg.predc - agg.price) ** 2).sum() / agg.shape[0]
err2
[58]:
20.697836056479865
Le second modèle est clairement meilleur.
[59]:
agg.plot(x="price", y="predc", kind="scatter")
[59]:
<Axes: xlabel='price', ylabel='predc'>
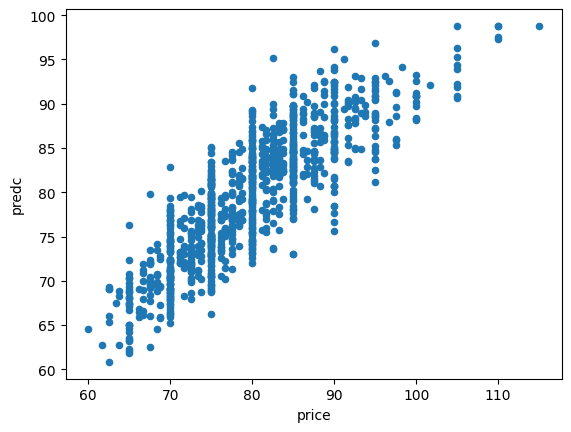
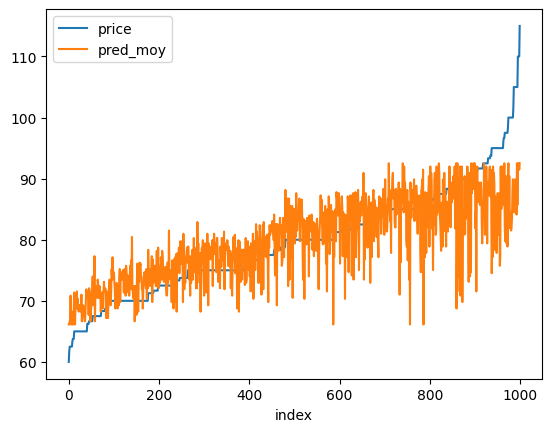
La seconde régression utilise une information dont on ne dispose pas au niveau agrégé : le jour de la semaine et un précédent graphe a clairement montré que c’était une variable importante. Un dernier graphe pour comparer les deux prédictions en montrant les prédictions triées par prix à prédire.
[60]:
temp = join.sort_values("price").reset_index(drop=True).reset_index(drop=False)
temp.head(n=1)
[60]:
| index | age | gender | idc | name | price | pred_moy | |
|---|---|---|---|---|---|---|---|
| 0 | 0 | 18 | 1 | 6423a722-4769-4a7c-8d1d-266538c2a07a | Balthazar | 60.0 | 66.12617 |
[61]:
temp.plot(x="index", y=["price", "pred_moy"])
[61]:
<Axes: xlabel='index'>
[62]:
temp2 = agg.sort_values("price").reset_index(drop=True).reset_index(drop=False)
temp2.head(n=1)
[62]:
| index | predc | price | |
|---|---|---|---|
| 0 | 0 | 64.54544 | 60.0 |
[63]:
ax = temp.plot(x="index", y="price", figsize=(14, 4), ylim=[60, 120])
temp.plot(x="index", y="pred_moy", linewidth=1, ax=ax, ylim=[60, 120])
temp2.plot(x="index", y="predc", ax=ax, linewidth=0.6, ylim=[60, 120])
[63]:
<Axes: xlabel='index'>

C’est finalement un peu plus visible sur le graphe précédent (nuage de points) mais aussi un peu trompeur du fait de la superposition des points. Une dernière remarque. En machine learning, nous avons l’habitude d’apprendre un modèle sur une base d’apprentissage et de tester les prédictions sur une autre. Dans notre cas, nous avons appris et prédit sur la même base. Ce type de tester est évidemment plus fiable. Mais nous avons comparé ici deux erreurs d’apprentissage moyennes et c’est exactement
ce que l’on fait lorsqu’on compare deux coefficients .
Un dernier graphe pour la route obtenu en triant les erreurs par ordre croissant.
[64]:
temp["erreur"] = temp.pred_moy - temp.price
temp2["erreur2"] = temp2.predc - temp2.price
ax = temp[["erreur"]].sort_values("erreur").reset_index(drop=True).plot()
temp2[["erreur2"]].sort_values("erreur2").reset_index(drop=True).plot(ax=ax)
ax.plot([0, 1000], [0, 0], "r--")
[64]:
[<matplotlib.lines.Line2D at 0x7fb2fa805210>]
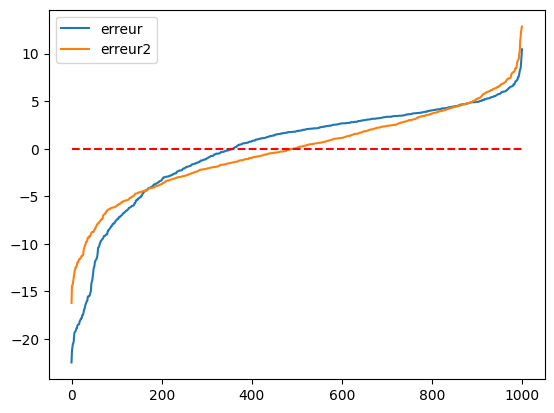
Le second modèle fait des erreurs moins importantes surtout côté négatif. Il sous-estime moins la bonne valeur.
Traitement spécifique de la variable catégorielle weekday
Le second modèle ne prend pas en compte le dimanche comme jour de la semaine. weekday est une variable catégorielle. Contrairment au genre, elle possède plus de deux modalités. Il serait intéressant de la traiter comme un ensemble de variable binaire et non une colonne de type entier.
[65]:
dummies = pandas.get_dummies(mat.weekday)
dummies.columns = ["lu", "ma", "me", "je", "ve", "sa", "di"]
dummies.head()
[65]:
| lu | ma | me | je | ve | sa | di | |
|---|---|---|---|---|---|---|---|
| 0 | False | False | False | False | True | False | False |
| 1 | False | False | False | False | True | False | False |
| 2 | False | False | True | False | False | False | False |
| 3 | False | False | False | False | False | True | False |
| 4 | False | False | False | False | False | True | False |
On supprime une modalité pour éviter d’avoir une matrice corrélée avec la constante et on ajoute des variables au modèle de régression.
[66]:
mat2 = pandas.concat([mat, dummies.drop("lu", axis=1)], axis=1)
mat2.head(n=1)
[66]:
| date | idc | idr | price | date2 | weekday | constant | jour | jouri | diff | ... | delay1 | age | gender | name | ma | me | je | ve | sa | di | |
|---|---|---|---|---|---|---|---|---|---|---|---|---|---|---|---|---|---|---|---|---|---|
| 0 | 2016-12-02 19:47:45.068274 | 4ba0b473-f8ca-4466-a65b-40e9b8ba5029 | b7db0ac9-86a1-46f9-98ac-f1f8eb54072d | 75.0 | 2016-12-02 19:47:45.068274 | 4 | 2016-11-18 19:47:45.068274 | 14 days | 14 | -26.0 | ... | 0.002732 | 37 | 0 | Cendrillon | False | False | False | True | False | False |
1 rows × 22 columns
[67]:
lr = ols(
    "price ~ age + gender + delay + delay1 + ma + me + je + ve + sa + di", data=mat2
)
res = lr.fit()
res.summary()
[67]:
| Dep. Variable: | price | R-squared: | 0.918 |
|---|---|---|---|
| Model: | OLS | Adj. R-squared: | 0.917 |
| Method: | Least Squares | F-statistic: | 2812. |
| Date: | Thu, 25 Jan 2024 | Prob (F-statistic): | 0.00 |
| Time: | 11:15:41 | Log-Likelihood: | -6293.7 |
| No. Observations: | 2537 | AIC: | 1.261e+04 |
| Df Residuals: | 2526 | BIC: | 1.267e+04 |
| Df Model: | 10 | ||
| Covariance Type: | nonrobust |
| coef | std err | t | P>|t| | [0.025 | 0.975] | |
|---|---|---|---|---|---|---|
| Intercept | 59.0371 | 0.272 | 217.342 | 0.000 | 58.504 | 59.570 |
| ma[T.True] | -0.0840 | 0.208 | -0.405 | 0.686 | -0.491 | 0.323 |
| me[T.True] | 0.3003 | 0.216 | 1.392 | 0.164 | -0.123 | 0.723 |
| je[T.True] | 0.1607 | 0.219 | 0.735 | 0.463 | -0.268 | 0.590 |
| ve[T.True] | -0.1748 | 0.212 | -0.825 | 0.409 | -0.590 | 0.240 |
| sa[T.True] | 0.1849 | 0.210 | 0.879 | 0.379 | -0.227 | 0.597 |
| di[T.True] | 20.0978 | 0.211 | 95.203 | 0.000 | 19.684 | 20.512 |
| age | 0.5005 | 0.005 | 104.318 | 0.000 | 0.491 | 0.510 |
| gender | -4.0722 | 0.115 | -35.321 | 0.000 | -4.298 | -3.846 |
| delay | 0.0003 | 0.000 | 0.661 | 0.509 | -0.001 | 0.001 |
| delay1 | -20.7385 | 2.236 | -9.275 | 0.000 | -25.123 | -16.354 |
| Omnibus: | 257.849 | Durbin-Watson: | 2.034 |
|---|---|---|---|
| Prob(Omnibus): | 0.000 | Jarque-Bera (JB): | 484.437 |
| Skew: | -0.672 | Prob(JB): | 6.40e-106 |
| Kurtosis: | 4.666 | Cond. No. | 9.20e+03 |
Notes:
[1] Standard Errors assume that the covariance matrix of the errors is correctly specified.
[2] The condition number is large, 9.2e+03. This might indicate that there are
strong multicollinearity or other numerical problems.
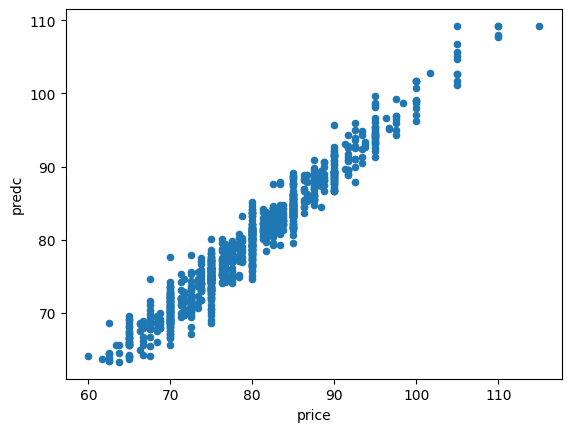
On vérifie que le coefficient pour dimanche n’est clairement significatif contrairement aux autres dont la probabilité d’être nul est élevée. Le médecin appliquerait une majoration de 20 euros le dimanche. Le coefficient est aussi nettement plus élevé. On construit les prédictions d’un second modèle en ne tenant compte que de la variable dimanche.
[68]:
lrc = LinearRegression()
feat2 = mat2[["age", "gender", "delay", "delay1", "price", "idc", "di"]].copy()
lrc.fit(feat2[["age", "gender", "delay", "delay1", "di"]], feat2["price"])
lrc.coef_, lrc.intercept_
[68]:
(array([ 5.00892234e-01, -4.07229120e+00,  2.97614199e-04, -2.07004497e+01,
         2.00395644e+01]),
 59.07951294272968)
[69]:
predc = lrc.predict(feat2[["age", "gender", "delay", "delay1", "di"]])
feat2["predc"] = predc
feat2.head()
[69]:
| age | gender | delay | delay1 | price | idc | di | predc | |
|---|---|---|---|---|---|---|---|---|
| 0 | 37 | 0 | 365.0 | 0.002732 | 75.0 | 4ba0b473-f8ca-4466-a65b-40e9b8ba5029 | False | 77.664596 |
| 1 | 37 | 0 | 365.0 | 0.002732 | 65.0 | 4ba0b473-f8ca-4466-a65b-40e9b8ba5029 | False | 77.664596 |
| 2 | 41 | 0 | 365.0 | 0.002732 | 75.0 | f44b004b-b01e-4835-b86d-1a42846c6d93 | False | 79.668165 |
| 3 | 41 | 0 | 29.0 | 0.033333 | 80.0 | f44b004b-b01e-4835-b86d-1a42846c6d93 | False | 78.934710 |
| 4 | 41 | 0 | 50.0 | 0.019608 | 80.0 | f44b004b-b01e-4835-b86d-1a42846c6d93 | False | 79.225084 |
[70]:
agg2 = feat2[["idc", "predc", "price"]].groupby("idc").mean()
agg2.head()
[70]:
| predc | price | |
|---|---|---|
| idc | ||
| 003b0195-2acb-4f46-b7fa-28cf266a8f60 | 80.103904 | 80.0 |
| 009e689c-51a1-4cef-99ca-a4ba364eba8d | 80.812446 | 80.0 |
| 00a213c2-1174-4359-8a67-fe710ec1b439 | 67.581598 | 70.0 |
| 00e42818-aade-4758-a5f6-c78a6f235ea5 | 66.890947 | 70.0 |
| 0153b785-9acd-4d28-aad1-62f8bf2faea3 | 74.158351 | 75.0 |
[71]:
err2d = ((agg2.predc - agg2.price) ** 2).sum() / agg2.shape[0]
err2d
[71]:
3.626505427547838
Nettement, nettement mieux.
[72]:
agg2.plot(x="price", y="predc", kind="scatter")
[72]:
<Axes: xlabel='price', ylabel='predc'>
[73]:
temp2 = agg2.sort_values("price").reset_index(drop=True).reset_index(drop=False)
ax = temp2.plot(x="index", y="price", figsize=(14, 4), ylim=[60, 120])
temp2.plot(x="index", y="predc", linewidth=1, ax=ax, ylim=[60, 120])
[73]:
<Axes: xlabel='index'>

Une variable catégorielle en une seule colonne ?
Un jeu de données peut rapidement croître s’il est étendu pour chaque variable catégorielle. On peut utiliser le module category_encoders ou statsmodels.
[74]:
from category_encoders import PolynomialEncoder

encoder = PolynomialEncoder(cols=["weekday"])
encoder.fit(rend[["weekday"]], rend["price"])
pred = encoder.transform(rend[["weekday"]])
conc = pandas.concat([rend[["weekday"]], pred], axis=1)
conc.head()
~/.local/lib/python3.10/site-packages/category_encoders/base_contrast_encoder.py:126: FutureWarning: Intercept column might not be added anymore in future releases (c.f. issue #370)
  warnings.warn("Intercept column might not be added anymore in future releases (c.f. issue #370)",
~/.local/lib/python3.10/site-packages/category_encoders/base_contrast_encoder.py:126: FutureWarning: Intercept column might not be added anymore in future releases (c.f. issue #370)
  warnings.warn("Intercept column might not be added anymore in future releases (c.f. issue #370)",
[74]:
| weekday | intercept | weekday_0 | weekday_1 | weekday_2 | weekday_3 | weekday_4 | weekday_5 | |
|---|---|---|---|---|---|---|---|---|
| 0 | 4 | 1 | -0.566947 | 0.545545 | -0.408248 | 0.241747 | -0.109109 | 0.032898 |
| 1 | 4 | 1 | -0.566947 | 0.545545 | -0.408248 | 0.241747 | -0.109109 | 0.032898 |
| 2 | 2 | 1 | -0.377964 | 0.000000 | 0.408248 | -0.564076 | 0.436436 | -0.197386 |
| 3 | 5 | 1 | -0.188982 | -0.327327 | 0.408248 | 0.080582 | -0.545545 | 0.493464 |
| 4 | 5 | 1 | -0.188982 | -0.327327 | 0.408248 | 0.080582 | -0.545545 | 0.493464 |
Ou associer la valeur de la cible à prédire pour chaque jour de la semaine.
[75]:
copy = rend[["weekday", "price"]].copy()
gr = copy.groupby("weekday", as_index=False).mean()
gr
[75]:
| weekday | price | |
|---|---|---|
| 0 | 0 | 76.112532 |
| 1 | 1 | 76.195373 |
| 2 | 2 | 77.047478 |
| 3 | 3 | 76.677116 |
| 4 | 4 | 76.049724 |
| 5 | 5 | 76.630728 |
| 6 | 6 | 97.078804 |
[76]:
feat3 = mat[["age", "gender", "delay", "delay1", "price", "idc", "weekday"]]
feat3 = feat3.merge(gr, on="weekday", suffixes=("", "_label"))
feat3.head()
[76]:
| age | gender | delay | delay1 | price | idc | weekday | price_label | |
|---|---|---|---|---|---|---|---|---|
| 0 | 37 | 0 | 365.0 | 0.002732 | 75.0 | 4ba0b473-f8ca-4466-a65b-40e9b8ba5029 | 4 | 76.049724 |
| 1 | 37 | 0 | 365.0 | 0.002732 | 65.0 | 4ba0b473-f8ca-4466-a65b-40e9b8ba5029 | 4 | 76.049724 |
| 2 | 57 | 1 | 365.0 | 0.002732 | 85.0 | 7ffb8a8b-a829-41f1-9572-2985ee9ba05e | 4 | 76.049724 |
| 3 | 30 | 0 | 365.0 | 0.002732 | 75.0 | 0153b785-9acd-4d28-aad1-62f8bf2faea3 | 4 | 76.049724 |
| 4 | 28 | 1 | 28.0 | 0.034483 | 70.0 | 47e415f0-f4e9-40c5-a59d-adc4c0621c8a | 4 | 76.049724 |
On apprend avec la variable weekday :
[77]:
lr = ols("price ~ age + gender + delay + delay1 + weekday", data=feat3)
res = lr.fit()
res.summary()
[77]:
| Dep. Variable: | price | R-squared: | 0.612 |
|---|---|---|---|
| Model: | OLS | Adj. R-squared: | 0.612 |
| Method: | Least Squares | F-statistic: | 800.0 |
| Date: | Thu, 25 Jan 2024 | Prob (F-statistic): | 0.00 |
| Time: | 11:15:56 | Log-Likelihood: | -8257.2 |
| No. Observations: | 2537 | AIC: | 1.653e+04 |
| Df Residuals: | 2531 | BIC: | 1.656e+04 |
| Df Model: | 5 | ||
| Covariance Type: | nonrobust |
| coef | std err | t | P>|t| | [0.025 | 0.975] | |
|---|---|---|---|---|---|---|
| Intercept | 55.4146 | 0.545 | 101.618 | 0.000 | 54.345 | 56.484 |
| age | 0.5081 | 0.010 | 48.918 | 0.000 | 0.488 | 0.528 |
| gender | -4.4125 | 0.250 | -17.683 | 0.000 | -4.902 | -3.923 |
| delay | 0.0005 | 0.001 | 0.562 | 0.574 | -0.001 | 0.002 |
| delay1 | -16.0797 | 4.842 | -3.321 | 0.001 | -25.575 | -6.585 |
| weekday | 2.1216 | 0.061 | 34.623 | 0.000 | 2.001 | 2.242 |
| Omnibus: | 55.147 | Durbin-Watson: | 0.442 |
|---|---|---|---|
| Prob(Omnibus): | 0.000 | Jarque-Bera (JB): | 57.558 |
| Skew: | 0.358 | Prob(JB): | 3.17e-13 |
| Kurtosis: | 2.823 | Cond. No. | 9.20e+03 |
Notes:
[1] Standard Errors assume that the covariance matrix of the errors is correctly specified.
[2] The condition number is large, 9.2e+03. This might indicate that there are
strong multicollinearity or other numerical problems.
Et on compare avec la variable price_label :
[78]:
lr = ols("price ~ age + gender + delay + delay1 + price_label", data=feat3)
res = lr.fit()
res.summary()
[78]:
| Dep. Variable: | price | R-squared: | 0.917 |
|---|---|---|---|
| Model: | OLS | Adj. R-squared: | 0.917 |
| Method: | Least Squares | F-statistic: | 5611. |
| Date: | Thu, 25 Jan 2024 | Prob (F-statistic): | 0.00 |
| Time: | 11:15:58 | Log-Likelihood: | -6298.8 |
| No. Observations: | 2537 | AIC: | 1.261e+04 |
| Df Residuals: | 2531 | BIC: | 1.264e+04 |
| Df Model: | 5 | ||
| Covariance Type: | nonrobust |
| coef | std err | t | P>|t| | [0.025 | 0.975] | |
|---|---|---|---|---|---|---|
| Intercept | -14.9859 | 0.664 | -22.576 | 0.000 | -16.288 | -13.684 |
| age | 0.5000 | 0.005 | 104.173 | 0.000 | 0.491 | 0.509 |
| gender | -4.0767 | 0.115 | -35.344 | 0.000 | -4.303 | -3.851 |
| delay | 0.0003 | 0.000 | 0.601 | 0.548 | -0.001 | 0.001 |
| delay1 | -20.8060 | 2.237 | -9.303 | 0.000 | -25.192 | -16.420 |
| price_label | 0.9696 | 0.008 | 122.209 | 0.000 | 0.954 | 0.985 |
| Omnibus: | 249.245 | Durbin-Watson: | 2.035 |
|---|---|---|---|
| Prob(Omnibus): | 0.000 | Jarque-Bera (JB): | 459.156 |
| Skew: | -0.660 | Prob(JB): | 1.98e-100 |
| Kurtosis: | 4.613 | Cond. No. | 9.47e+03 |
Notes:
[1] Standard Errors assume that the covariance matrix of the errors is correctly specified.
[2] The condition number is large, 9.47e+03. This might indicate that there are
strong multicollinearity or other numerical problems.
Aussi bien qu’avec la variable dimanche.