Tracer une pyramide bigarrée - correction
Cet exercice est inspirée de l’article Les Fermes Miracle, un verger commercial de 5 acres inspiré de la permaculture dans le sud du Québec. Il s’agit de dessiner un motif. Correction.
[10]:
%matplotlib inline
Problème
Il s’agit de dessiner la pyramide suivante à l’aide de matplotlib.
[2]:
from IPython.display import Image

Image("biodiversite_tri2.png")
[2]:

Idée de la solution
On sépare le problème en deux plus petits :
Trouver la position des boules dans un repère cartésien.
Choisir la bonne couleur.
Le repère est hexagonal. L’image suivante est tirée de la page wikipédia empilement compact.
[12]:
Image("hexa.png")
[12]:
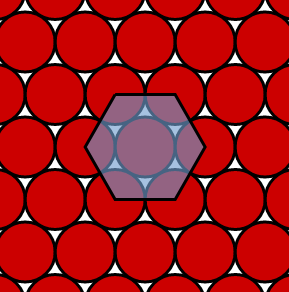
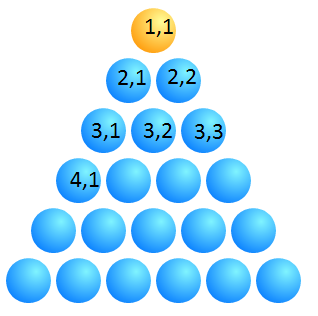
Mais dans un premier temps, il faut un moyen de repérer chaque boule. On les numérote avec deux indices.
[3]:
Image("pyramide_num2.png")
[3]:
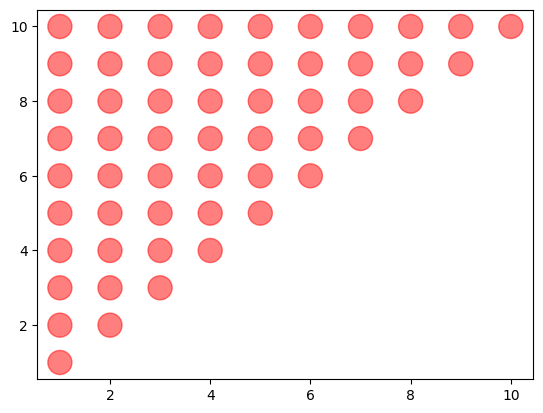
Les coordonnées
On prend comme exemple scatter_demo.py sur le site de matplotlib.
[14]:
import matplotlib.pyplot as plt

fig, ax = plt.subplots(1, 1)
n = 10
x = []
y = []
for i in range(1, n + 1):
    for j in range(i, n + 1):
        x.append(i)
        y.append(j)
size = [300 for c in x]
colors = ["r" for c in x]
ax.scatter(x, y, s=size, c=colors, alpha=0.5);
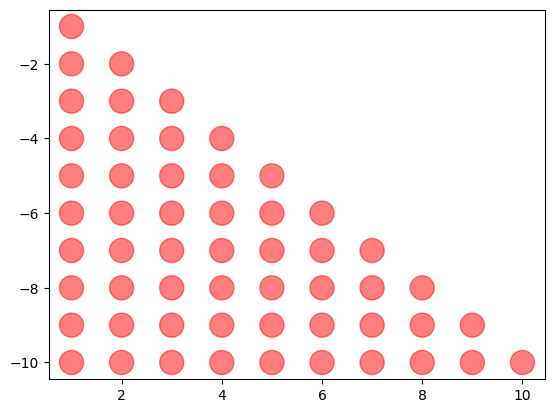
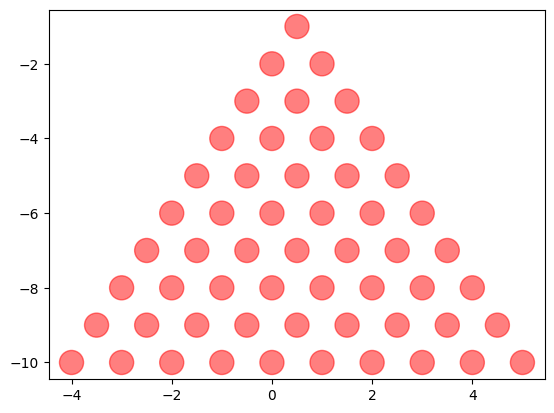
On inverse.
[15]:
fig, ax = plt.subplots(1, 1)
n = 10
x = []
y = []
for i in range(1, n + 1):
    for j in range(i, n + 1):
        x.append(i)
        y.append(-j)
size = [300 for c in x]
colors = ["r" for c in x]
ax.scatter(x, y, s=size, c=colors, alpha=0.5);
On décale.
[16]:
fig, ax = plt.subplots(1, 1)
n = 10
x = []
y = []
for i in range(1, n + 1):
    for j in range(i, n + 1):
        x.append(i - j * 0.5)
        y.append(-j)
size = [300 for c in x]
colors = ["r" for c in x]
ax.scatter(x, y, s=size, c=colors, alpha=0.5);
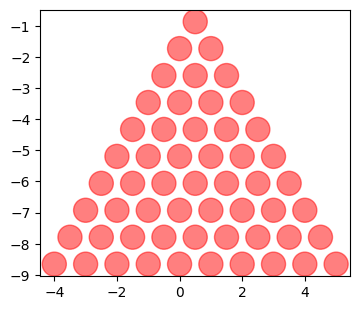
Cela ressemble à de l’hexagonal mais ce n’est pas encore tout à fait cela. La hauteur d’un triangle équilatéral de côté un est  . Ca tombe bien car dans l’exemple précédente, le côté de chaque triangle est 1. Et on change la dimension du graphe tracé avec matplotlib pour éviter de réduire nos effort à néant.
[17]:
fig, ax = plt.subplots(1, 1, figsize=(4, 4 * (3**0.5) / 2))
n = 10
x = []
y = []
for i in range(1, n + 1):
    for j in range(i, n + 1):
        x.append(i - j * 0.5)
        y.append(-j * (3**0.5) / 2)
size = [300 for c in x]
colors = ["r" for c in x]
ax.scatter(x, y, s=size, c=colors, alpha=0.5);
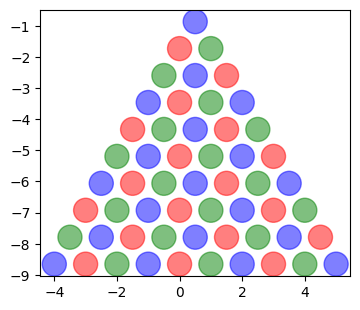
La couleur
Je vous laisse retourner sur les deux premières images et observer la couleur de toutes les boules qui vérifient (i+j)%3 == 1.
[18]:
fig, ax = plt.subplots(1, 1, figsize=(4, 4 * (3**0.5) / 2))
n = 10
x = []
y = []
colors = []
trois = "rgb"
for i in range(1, n + 1):
    for j in range(i, n + 1):
        x.append(i - j * 0.5)
        y.append(-j * (3**0.5) / 2)
        colors.append(trois[(i + j) % 3])
size = [300 for c in x]
ax.scatter(x, y, s=size, c=colors, alpha=0.5);
[ ]: