1A.e - TD noté, 27 novembre 2012 (coloriage, correction)
Coloriage d’une image, dessin d’une spirale avec matplotlib.
[1]:
%matplotlib inline
import matplotlib.pyplot as plt
Populating the interactive namespace from numpy and matplotlib
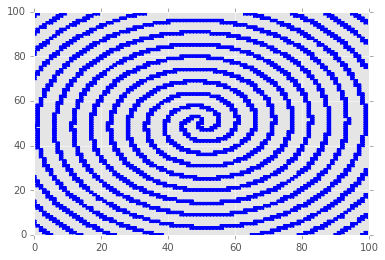
construction de la spirale
On utilise une représentation paramétrique de la spirale : spirale.
[3]:
import math


# cette fonction construit deux spirales imbriquées dans une matrice nb x nb
# le résultat est retourné sous forme de liste de listes
def construit_matrice(nb):
    mat = [[0 for x in range(0, nb)] for y in range(0, nb)]

    def pointij(nb, r, th, mat, c, phase):
        i, j = r * th * math.cos(th + phase), r * th * math.sin(th + phase)
        i, j = int(i * 100 / nb), int(j * 100 / nb)
        i, j = (i + nb) // 2, (j + nb) // 2
        if 0 <= i < nb and 0 <= j < nb:
            mat[i][j] = c
        return i, j

    r = 3.5
    t = 0
    for tinc in range(nb * 100000):
        t += 1.0 * nb / 100000
        th = t * math.pi * 2
        i, j = pointij(nb, r, th, mat, 1, 0)
        i, j = pointij(nb, r, th, mat, 1, math.pi)
        if i >= nb and j >= nb:
            break

    return mat


matrice = construit_matrice(100)
dessin de la spirale
[4]:
import matplotlib.pyplot as plt


def dessin_matrice(matrice):
    f, ax = plt.subplots()
    ax.set_ylim([0, len(matrice[0])])
    ax.set_xlim([0, len(matrice)])
    colors = {1: "blue", 2: "red"}
    for i in range(0, len(matrice)):
        for j in range(0, len(matrice[i])):
            if matrice[i][j] in colors:
                ax.plot(
                    [
                        i - 0.5,
                        i - 0.5,
                        i + 0.5,
                        i + 0.5,
                        i - 0.5,
                        i + 0.5,
                        i - 0.5,
                        i + 0.5,
                    ],
                    [
                        j - 0.5,
                        j + 0.5,
                        j + 0.5,
                        j - 0.5,
                        j - 0.5,
                        j + 0.5,
                        j + 0.5,
                        j - 0.5,
                    ],
                    colors[matrice[i][j]],
                )
    return ax


dessin_matrice(matrice)
[4]:
<matplotlib.axes._subplots.AxesSubplot at 0x87cef28>
Q1
[5]:
def voisins_a_valeurs_nulle(matrice, i, j):
    res = []
    if i > 0 and matrice[i - 1][j] == 0:
        res.append((i - 1, j))
    if i < len(matrice) - 1 and matrice[i + 1][j] == 0:
        res.append((i + 1, j))
    if j > 0 and matrice[i][j - 1] == 0:
        res.append((i, j - 1))
    if j < len(matrice[i]) - 1 and matrice[i][j + 1] == 0:
        res.append((i, j + 1))
    return res
Q2
[6]:
def tous_voisins_a_valeurs_nulle(matrice, liste_points):
    res = []
    for i, j in liste_points:
        res += voisins_a_valeurs_nulle(matrice, i, j)
    return res
Q3
[7]:
def fonction_coloriage(matrice, i0, j0):
    # étage 1
    acolorier = [(i0, j0)]
    while len(acolorier) > 0:
        # étape 2
        for i, j in acolorier:
            matrice[i][j] = 2
        # étape 3
        acolorier = tous_voisins_a_valeurs_nulle(matrice, acolorier)
        # on enlève les doublons car sinon cela prend trop de temps
        acolorier = list(set(acolorier))
Q5
version 1
[8]:
def surface_coloriee(matrice):
    surface = 0
    for line in matrice:
        for c in line:
            if c == 2:
                surface += 1
    return surface
version 4
[9]:
def fonction_coloriage_1000(matrice, i0, j0):
    acolorier = [(i0, j0)]
    nb = 0  # ligne ajoutée
    while len(acolorier) > 0:
        for i, j in acolorier:
            matrice[i][j] = 2
            nb += 1  # ligne ajoutée
        if nb > 1000:
            break  # ligne ajoutée
        acolorier = tous_voisins_a_valeurs_nulle(matrice, acolorier)
        d = {}
        for i, j in acolorier:
            d[i, j] = 0
        acolorier = [(i, j) for i, j in d]
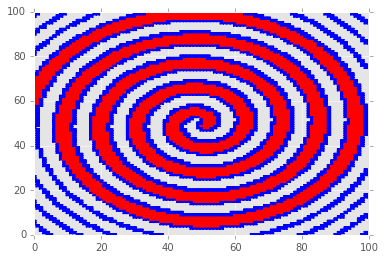
Q4 : spirale
version 1
[10]:
matrice = construit_matrice(100)
fonction_coloriage(matrice, 53, 53)
dessin_matrice(matrice)
[10]:
<matplotlib.axes._subplots.AxesSubplot at 0x14675b00>
[11]:
surface_coloriee(matrice)
[11]:
3258
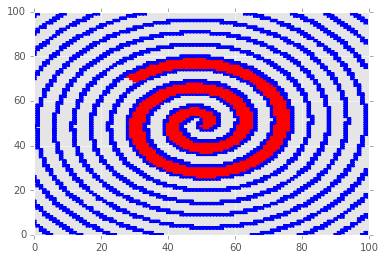
version 4
[12]:
matrice = construit_matrice(100)
fonction_coloriage_1000(matrice, 53, 53)
dessin_matrice(matrice)
[12]:
<matplotlib.axes._subplots.AxesSubplot at 0x1bc6a630>
[13]:
surface_coloriee(matrice)
[13]:
1002
[14]: