Régression linéaire
Ce notebook s’intéresse à la façon d’interpréter les résultats d’une régression linéaire lorsque les variables sont corrélées puis il explore une façon d’associer arbre de décision et régression linéaire pour construire une régression linéaire par morceaux.
[11]:
%matplotlib inline
Un cas simple
Une façon d’interpréter des résultats statistiques est de les calculer dans un cas où la réponse cherchée est connue. On simule un modèle simple et on cale une régression linéaire. On suppose que
sont des variables aléatoires gaussiennes de même variance et moyenne.
[12]:
import numpy.random as npr

eps = npr.normal(1000)
X = npr.normal(size=(1000, 3))
alpha = 2
Y = alpha * X[:, 0] + X[:, 2]
X.shape, Y.shape
[12]:
((1000, 3), (1000,))
[13]:
from numpy import corrcoef

corrcoef(X.T)
[13]:
array([[ 1.        ,  0.02585011, -0.00808406],
       [ 0.02585011,  1.        ,  0.00338766],
       [-0.00808406,  0.00338766,  1.        ]])
[14]:
from statsmodels.regression.linear_model import OLS
[15]:
model = OLS(Y, X[:, :2])
results = model.fit()
su = results.summary()
su
[15]:
| Dep. Variable: | y | R-squared (uncentered): | 0.803 |
|---|---|---|---|
| Model: | OLS | Adj. R-squared (uncentered): | 0.802 |
| Method: | Least Squares | F-statistic: | 2029. |
| Date: | Mon, 07 Oct 2024 | Prob (F-statistic): | 0.00 |
| Time: | 11:29:03 | Log-Likelihood: | -1417.8 |
| No. Observations: | 1000 | AIC: | 2840. |
| Df Residuals: | 998 | BIC: | 2849. |
| Df Model: | 2 | ||
| Covariance Type: | nonrobust |
| coef | std err | t | P>|t| | [0.025 | 0.975] | |
|---|---|---|---|---|---|---|
| x1 | 1.9922 | 0.031 | 63.680 | 0.000 | 1.931 | 2.054 |
| x2 | 0.0041 | 0.032 | 0.130 | 0.896 | -0.058 | 0.067 |
| Omnibus: | 4.685 | Durbin-Watson: | 2.126 |
|---|---|---|---|
| Prob(Omnibus): | 0.096 | Jarque-Bera (JB): | 4.706 |
| Skew: | -0.167 | Prob(JB): | 0.0951 |
| Kurtosis: | 2.972 | Cond. No. | 1.03 |
Notes:
[1] R² is computed without centering (uncentered) since the model does not contain a constant.
[2] Standard Errors assume that the covariance matrix of the errors is correctly specified.
[16]:
results.rsquared, results.rsquared_adj
[16]:
(np.float64(0.8026213180783517), np.float64(0.8022257696175868))
On vérifie que le coefficient devant est non nul (P-value nulle, 0 n’est pas l’intervalle de confiance). Le coefficient devant
n’est pas nul mais presque, la P-value est élevée, le coefficient
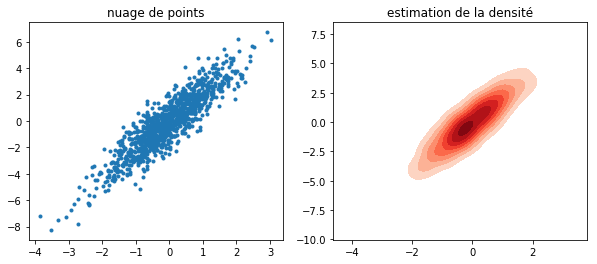
est élevé. Dessinons.
[17]:
import matplotlib.pyplot as plt
import seaborn

fig, ax = plt.subplots(1, 2, figsize=(10, 4))
ax[0].plot(X[:, 0], Y, ".")
seaborn.kdeplot(x=X[:, 0], y=Y, cmap="Reds", shade=True, shade_lowest=False, ax=ax[1])
ax[0].set_title("nuage de points")
ax[1].set_title("estimation de la densité");
/tmp/ipykernel_21413/1827909711.py:6: UserWarning:

`shade_lowest` has been replaced by `thresh`; setting `thresh=0.05.
This will become an error in seaborn v0.14.0; please update your code.

  seaborn.kdeplot(x=X[:, 0], y=Y, cmap="Reds", shade=True, shade_lowest=False, ax=ax[1])
/tmp/ipykernel_21413/1827909711.py:6: FutureWarning:

`shade` is now deprecated in favor of `fill`; setting `fill=True`.
This will become an error in seaborn v0.14.0; please update your code.

  seaborn.kdeplot(x=X[:, 0], y=Y, cmap="Reds", shade=True, shade_lowest=False, ax=ax[1])
Evolution de R2
Dans la régression précédente, le coefficient transcrit en quelque sorte la part du bruit
par rapport au terme
. Faisons varier
.
[18]:
alphas = []
r2s = []
for a in [0.1 * i for i in range(50)]:
    Y = a * X[:, 0] + X[:, 2]
    model = OLS(Y, X[:, :2])
    results = model.fit()
    alphas.append(a)
    r2s.append(results.rsquared)
[19]:
fig, ax = plt.subplots(1, 1)
ax.plot(alphas, r2s, ".", label="observed")
ax.plot(alphas, [a**2 / (1 + a**2) for a in alphas], label="theoretical")
ax.set_xlabel("alpha")
ax.set_ylabel("r2")
ax.legend();
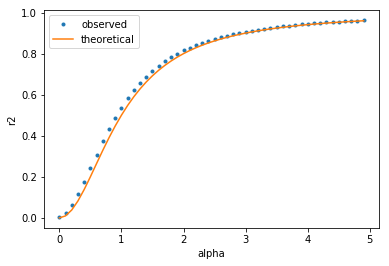
Dans ce cas de régression simple, la valeur à prédire est , la valeur prédite est
et la moyenne
.
Deux variables corrélées
On ne change pas le modèle mais on fait en sorte que . Les deux variables sont corrélées.
[20]:
X[:, 1] = X[:, 0]
Y = 2 * X[:, 0] + X[:, 2]
model = OLS(Y, X[:, :2])
results = model.fit()
results.summary()
[20]:
| Dep. Variable: | y | R-squared (uncentered): | 0.803 |
|---|---|---|---|
| Model: | OLS | Adj. R-squared (uncentered): | 0.802 |
| Method: | Least Squares | F-statistic: | 4062. |
| Date: | Mon, 07 Oct 2024 | Prob (F-statistic): | 0.00 |
| Time: | 11:29:04 | Log-Likelihood: | -1417.8 |
| No. Observations: | 1000 | AIC: | 2838. |
| Df Residuals: | 999 | BIC: | 2843. |
| Df Model: | 1 | ||
| Covariance Type: | nonrobust |
| coef | std err | t | P>|t| | [0.025 | 0.975] | |
|---|---|---|---|---|---|---|
| x1 | 0.9961 | 0.016 | 63.736 | 0.000 | 0.965 | 1.027 |
| x2 | 0.9961 | 0.016 | 63.736 | 0.000 | 0.965 | 1.027 |
| Omnibus: | 4.681 | Durbin-Watson: | 2.126 |
|---|---|---|---|
| Prob(Omnibus): | 0.096 | Jarque-Bera (JB): | 4.705 |
| Skew: | -0.167 | Prob(JB): | 0.0951 |
| Kurtosis: | 2.971 | Cond. No. | 3.15e+16 |
Notes:
[1] R² is computed without centering (uncentered) since the model does not contain a constant.
[2] Standard Errors assume that the covariance matrix of the errors is correctly specified.
[3] The smallest eigenvalue is 2.06e-30. This might indicate that there are
strong multicollinearity problems or that the design matrix is singular.
[21]:
model.rank
[21]:
np.int64(1)
Les variables corrélées n’ont pas l’air de déranger l’algorithme de résolution car il utilise la méthode SVD pour résoudre le même problème dans un espace de moindre dimension. Le problème survient que les deux variables ne sont pas complétement corrélées. On étudie le modèle avec
et on réduit la variance du bruit pour en diminuer les effets.
[22]:
X_ = npr.normal(size=(1000, 3))
[23]:
alphas = [0.9 + i * 0.01 for i in range(11)]
res = []
for a in alphas:
    X = X_.copy()
    X[:, 1] = a * X[:, 0] + (1 - a) * X[:, 1]
    Y = X[:, 0] + X[:, 1] + 0.1 * X[:, 2]
    model = OLS(Y, X[:, :2])
    results = model.fit()
    res.append(
        dict(
            alpha=a,
            r2=results.rsquared,
            rank=model.rank,
            c1=results.params[0],
            c2=results.params[1],
        )
    )

import pandas

df = pandas.DataFrame(res)
df = df.set_index("alpha")
df
[23]:
| r2 | rank | c1 | c2 | |
|---|---|---|---|---|
| alpha | ||||
| 0.90 | 0.997328 | 2 | 1.013974 | 0.986445 |
| 0.91 | 0.997353 | 2 | 1.015480 | 0.984939 |
| 0.92 | 0.997379 | 2 | 1.017363 | 0.983056 |
| 0.93 | 0.997403 | 2 | 1.019783 | 0.980636 |
| 0.94 | 0.997428 | 2 | 1.023011 | 0.977409 |
| 0.95 | 0.997453 | 2 | 1.027529 | 0.972890 |
| 0.96 | 0.997477 | 2 | 1.034306 | 0.966113 |
| 0.97 | 0.997501 | 2 | 1.045602 | 0.954817 |
| 0.98 | 0.997525 | 2 | 1.068193 | 0.932226 |
| 0.99 | 0.997548 | 2 | 1.135968 | 0.864452 |
| 1.00 | 0.997571 | 1 | 1.000861 | 1.000861 |
[24]:
fig, ax = plt.subplots(1, 2, figsize=(10, 4))
df[["r2"]].plot(ax=ax[0])
df[["c1", "c2"]].plot(ax=ax[1])
ax[0].set_title("R2")
ax[1].set_title("coefficients");
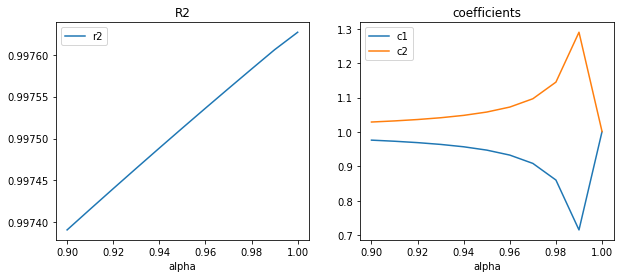
Le augmente quand la corrélation augmente mais les coefficients sont moins fiables. Les résultats devraient être sensiblement identiques en théorie mais en pratique, plus le déterminant devient proche de zéro, plus l’ordinateur est limité par sa précision numérique. Pour en savoir plus, vous pouvez lire un examen écrit que j’ai rédigé, en python bien sûr : Examen Programmation ENSAE première année
2006. Cette précision est aux alentours de
ce qui correspond à la précision numérique des double.
[25]:
alphas = [1 - 10 ** (-i) for i in range(10, 18)]
res = []
for a in alphas:
    X = X_.copy()
    X[:, 1] = a * X[:, 0] + (1 - a) * X[:, 1]
    Y = X[:, 0] + X[:, 1] + X[:, 2]
    model = OLS(Y, X[:, :2])
    results = model.fit()
    res.append(
        dict(
            alpha_1=a - 1,
            r2=results.rsquared,
            rank=model.rank,
            c1=results.params[0],
            c2=results.params[1],
        )
    )

import pandas

df = pandas.DataFrame(res)
df = df.set_index("alpha_1")
df
[25]:
| r2 | rank | c1 | c2 | |
|---|---|---|---|---|
| alpha_1 | ||||
| -1.000000e-10 | 0.806651 | 2 | 1.355493e+08 | -1.355493e+08 |
| -1.000000e-11 | 0.806651 | 2 | 1.355632e+09 | -1.355632e+09 |
| -9.999779e-13 | 0.806651 | 2 | 1.355997e+10 | -1.355997e+10 |
| -1.000311e-13 | 0.806651 | 2 | 1.357117e+11 | -1.357117e+11 |
| -9.992007e-15 | 0.806648 | 2 | 1.410632e+12 | -1.410632e+12 |
| -9.992007e-16 | 0.806616 | 2 | 1.008605e+00 | 1.008605e+00 |
| -1.110223e-16 | 0.806616 | 1 | 1.008605e+00 | 1.008605e+00 |
| 0.000000e+00 | 0.806616 | 1 | 1.008605e+00 | 1.008605e+00 |
On fait un dernier test avec scikit-learn pour vérifier que l’algorithme de résolution donne des résultats similaires pour un cas où le déterminant est quasi-nul.
[26]:
from sklearn.linear_model import LinearRegression
from sklearn.metrics import r2_score

alphas = [0.9 + i * 0.01 for i in range(11)]
res = []
for a in alphas:
    X = X_.copy()
    X[:, 1] = a * X[:, 0] + (1 - a) * X[:, 1]
    Y = X[:, 0] + X[:, 1] + X[:, 2]
    model = LinearRegression()
    model.fit(X[:, :2], Y)
    r2 = r2_score(Y, model.predict(X[:, :2]))
    res.append(dict(alpha=a, c1=model.coef_[0], c2=model.coef_[1], r2=r2))

import pandas

df = pandas.DataFrame(res)
df = df.set_index("alpha")
df
[26]:
| c1 | c2 | r2 | |
|---|---|---|---|
| alpha | |||
| 0.90 | 1.140599 | 0.863675 | 0.791250 |
| 0.91 | 1.155746 | 0.848528 | 0.792821 |
| 0.92 | 1.174680 | 0.829593 | 0.794384 |
| 0.93 | 1.199024 | 0.805250 | 0.795940 |
| 0.94 | 1.231482 | 0.772791 | 0.797489 |
| 0.95 | 1.276924 | 0.727350 | 0.799029 |
| 0.96 | 1.345087 | 0.659187 | 0.800562 |
| 0.97 | 1.458691 | 0.545583 | 0.802087 |
| 0.98 | 1.685900 | 0.318374 | 0.803603 |
| 0.99 | 2.367526 | -0.363252 | 0.805111 |
| 1.00 | 1.008682 | 1.008682 | 0.806575 |
[27]:
fig, ax = plt.subplots(1, 3, figsize=(12, 4))
df[["c1", "c2"]].plot(ax=ax[1])
df[["c1", "c2"]].plot(ax=ax[2])
df[["r2"]].plot(ax=ax[0])
ax[0].set_title("R2")
ax[1].set_title("coefficients")
ax[2].set_ylim([-5, 5])
ax[2].set_title("coefficients, échelle tronquée");
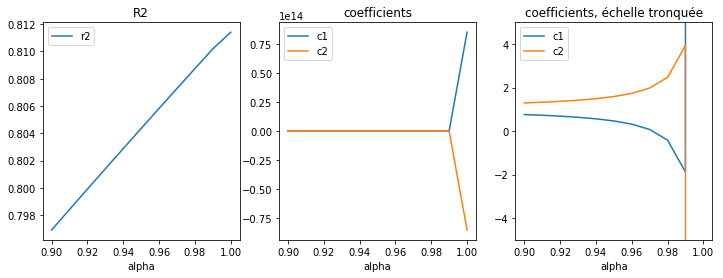
Le second graphe est trompeur mais il ne faut pas oublier de regarder l’échelle de l’axe des ordonnées.
Indicatrices
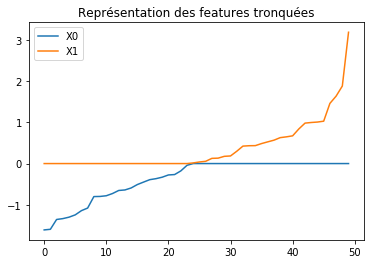
est une variable aléatoire gaussienne. On teste maintenant un modèle
avec
et
.
[28]:
X = npr.normal(size=(1000, 3))
X[:, 1] = X[:, 0]
X[X[:, 0] >= 0, 0] = 0
X[X[:, 1] < 0, 1] = 0
Y = X[:, 0] + X[:, 1] + X[:, 2]
corrcoef(X.T)
[28]:
array([[ 1.        ,  0.48561838,  0.0042644 ],
       [ 0.48561838,  1.        , -0.01058737],
       [ 0.0042644 , -0.01058737,  1.        ]])
[29]:
from pandas import DataFrame

names = ["X%d" % i for i in range(X.shape[1] - 1)]
ax = (
    DataFrame(X[:50, :2], columns=names)
    .sort_values(names)
    .reset_index(drop=True)
    .plot()
)
ax.set_title("Représentation des features tronquées");
[30]:
model = OLS(Y, X[:, :3])
results = model.fit()
results.summary()
[30]:
| Dep. Variable: | y | R-squared (uncentered): | 1.000 |
|---|---|---|---|
| Model: | OLS | Adj. R-squared (uncentered): | 1.000 |
| Method: | Least Squares | F-statistic: | 1.581e+33 |
| Date: | Mon, 07 Oct 2024 | Prob (F-statistic): | 0.00 |
| Time: | 11:29:06 | Log-Likelihood: | 33532. |
| No. Observations: | 1000 | AIC: | -6.706e+04 |
| Df Residuals: | 997 | BIC: | -6.704e+04 |
| Df Model: | 3 | ||
| Covariance Type: | nonrobust |
| coef | std err | t | P>|t| | [0.025 | 0.975] | |
|---|---|---|---|---|---|---|
| x1 | 1.0000 | 2.98e-17 | 3.35e+16 | 0.000 | 1.000 | 1.000 |
| x2 | 1.0000 | 2.73e-17 | 3.66e+16 | 0.000 | 1.000 | 1.000 |
| x3 | 1.0000 | 2.09e-17 | 4.79e+16 | 0.000 | 1.000 | 1.000 |
| Omnibus: | 20.214 | Durbin-Watson: | 1.267 |
|---|---|---|---|
| Prob(Omnibus): | 0.000 | Jarque-Bera (JB): | 30.796 |
| Skew: | 0.179 | Prob(JB): | 2.05e-07 |
| Kurtosis: | 3.781 | Cond. No. | 1.43 |
Notes:
[1] R² is computed without centering (uncentered) since the model does not contain a constant.
[2] Standard Errors assume that the covariance matrix of the errors is correctly specified.
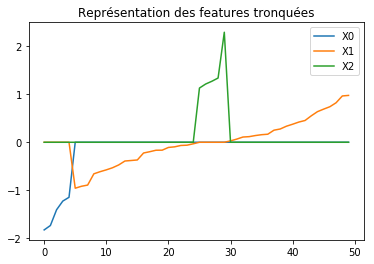
On découpe en trois.
[31]:
import numpy

X = npr.normal(size=(1000, 4))
for i in range(3):
    X[:, i] = X_[:, 0]
X[:, 3] = X_[:, 2]
X[X_[:, 0] > -1, 0] = 0
X[(X_[:, 0] < -1) | (X_[:, 0] > 1), 1] = 0
X[X_[:, 0] < 1, 2] = 0
Y = X[:, 0] + X[:, 1] + X[:, 2] + X[:, 3]
corrcoef(X.T)
[31]:
array([[ 1.        , -0.0221138 ,  0.15312241, -0.01158589],
       [-0.0221138 ,  1.        ,  0.02182757,  0.03734989],
       [ 0.15312241,  0.02182757,  1.        ,  0.01263351],
       [-0.01158589,  0.03734989,  0.01263351,  1.        ]])
[32]:
from pandas import DataFrame

names = ["X%d" % i for i in range(X.shape[1] - 1)]
ax = (
    DataFrame(X[:50, :3], columns=names)
    .sort_values(names)
    .reset_index(drop=True)
    .plot()
)
ax.set_title("Représentation des features tronquées");
[33]:
model = OLS(Y, X[:, :4])
results = model.fit()
results.summary()
[33]:
| Dep. Variable: | y | R-squared (uncentered): | 1.000 |
|---|---|---|---|
| Model: | OLS | Adj. R-squared (uncentered): | 1.000 |
| Method: | Least Squares | F-statistic: | 3.030e+31 |
| Date: | Mon, 07 Oct 2024 | Prob (F-statistic): | 0.00 |
| Time: | 11:29:06 | Log-Likelihood: | 31722. |
| No. Observations: | 1000 | AIC: | -6.344e+04 |
| Df Residuals: | 996 | BIC: | -6.342e+04 |
| Df Model: | 4 | ||
| Covariance Type: | nonrobust |
| coef | std err | t | P>|t| | [0.025 | 0.975] | |
|---|---|---|---|---|---|---|
| x1 | 1.0000 | 2.07e-16 | 4.84e+15 | 0.000 | 1.000 | 1.000 |
| x2 | 1.0000 | 2.87e-16 | 3.49e+15 | 0.000 | 1.000 | 1.000 |
| x3 | 1.0000 | 2.01e-16 | 4.97e+15 | 0.000 | 1.000 | 1.000 |
| x4 | 1.0000 | 1.3e-16 | 7.66e+15 | 0.000 | 1.000 | 1.000 |
| Omnibus: | 457.510 | Durbin-Watson: | 1.879 |
|---|---|---|---|
| Prob(Omnibus): | 0.000 | Jarque-Bera (JB): | 1715.476 |
| Skew: | 2.280 | Prob(JB): | 0.00 |
| Kurtosis: | 7.514 | Cond. No. | 2.20 |
Notes:
[1] R² is computed without centering (uncentered) since the model does not contain a constant.
[2] Standard Errors assume that the covariance matrix of the errors is correctly specified.
Régression linéaire par morceaux
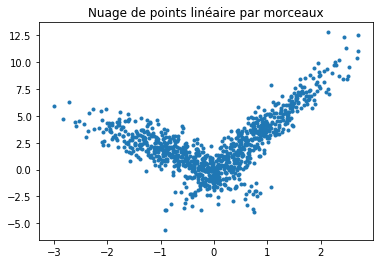
On se place dans un cas particulier où le problème est linéaire par morceaux :
La régression donne de très mauvais résultat sur ce type de problèmes mais on cherche une façon systématique de découper le problème en segments linéaires.
[34]:
X = npr.normal(size=(1000, 4))
alpha = [4, -2]
t = (X[:, 0] + X[:, 3] * 0.5) > 0
switch = numpy.zeros(X.shape[0])
switch[t] = 1
Y = alpha[0] * X[:, 0] * t + alpha[1] * X[:, 0] * (1 - t) + X[:, 2]
[35]:
fig, ax = plt.subplots(1, 1)
ax.plot(X[:, 0], Y, ".")
ax.set_title("Nuage de points linéaire par morceaux");
[36]:
model = OLS(Y, X[:, :1])
results = model.fit()
results.summary()
[36]:
| Dep. Variable: | y | R-squared (uncentered): | 0.107 |
|---|---|---|---|
| Model: | OLS | Adj. R-squared (uncentered): | 0.106 |
| Method: | Least Squares | F-statistic: | 119.3 |
| Date: | Mon, 07 Oct 2024 | Prob (F-statistic): | 2.56e-26 |
| Time: | 11:29:06 | Log-Likelihood: | -2555.7 |
| No. Observations: | 1000 | AIC: | 5113. |
| Df Residuals: | 999 | BIC: | 5118. |
| Df Model: | 1 | ||
| Covariance Type: | nonrobust |
| coef | std err | t | P>|t| | [0.025 | 0.975] | |
|---|---|---|---|---|---|---|
| x1 | 1.0940 | 0.100 | 10.924 | 0.000 | 0.897 | 1.290 |
| Omnibus: | 3.084 | Durbin-Watson: | 1.111 |
|---|---|---|---|
| Prob(Omnibus): | 0.214 | Jarque-Bera (JB): | 2.960 |
| Skew: | 0.088 | Prob(JB): | 0.228 |
| Kurtosis: | 2.801 | Cond. No. | 1.00 |
Notes:
[1] R² is computed without centering (uncentered) since the model does not contain a constant.
[2] Standard Errors assume that the covariance matrix of the errors is correctly specified.
[37]:
yp = results.predict(X[:, :1])
[38]:
fig, ax = plt.subplots(1, 1)
ax.plot(X[:, 0], Y, ".", label="expected")
ax.plot(X[:, 0], yp, ".", label="predicted")
ax.legend()
ax.set_title("Régression linéaire sur un nuage linéaire par morceaux");
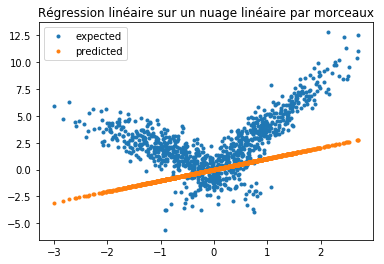
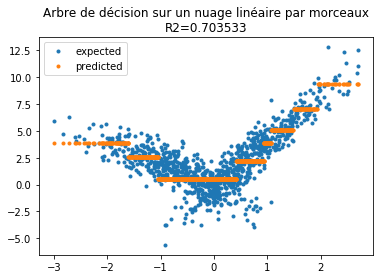
Passons à un arbre de décision qui n’est pas le meilleur modèle mais on va détourner ses résultats pour revenir à un problème de régression par morceaux.
[39]:
from sklearn.tree import DecisionTreeRegressor

model = DecisionTreeRegressor(min_samples_leaf=10, max_depth=3)
model.fit(X[:, :1], Y)
yp = model.predict(X[:, :1])
[40]:
fig, ax = plt.subplots(1, 1)
ax.plot(X[:, 0], Y, ".", label="expected")
ax.plot(X[:, 0], yp, ".", label="predicted")
ax.legend()
r2 = r2_score(Y, model.predict(X[:, :1]))
ax.set_title("Arbre de décision sur un nuage linéaire par morceaux\nR2=%f" % r2);
[41]:
import graphviz
from sklearn.tree import export_graphviz

dot = export_graphviz(model)

src = graphviz.Source(dot)
src.render("tree_dot.gv")
[41]:
'tree_dot.gv.pdf'
On extrait tous les seuils de l’arbre et on ajoute les milieux de segments.
[42]:
th = list(sorted(set(model.tree_.threshold)))
th += [(th[i] + th[i - 1]) / 2 for i in range(1, len(th))]
th = list(sorted(th))
th
[42]:
[np.float64(-2.0),
 np.float64(-1.85539710521698),
 np.float64(-1.71079421043396),
 np.float64(-1.3022041469812393),
 np.float64(-0.8936140835285187),
 np.float64(-0.2086283266544342),
 np.float64(0.47635743021965027),
 np.float64(0.6395495533943176),
 np.float64(0.802741676568985),
 np.float64(0.942541167140007),
 np.float64(1.082340657711029),
 np.float64(1.310522198677063),
 np.float64(1.538703739643097),
 np.float64(1.6980005204677582),
 np.float64(1.8572973012924194)]
On fait une régression sur les variables ,
où les
sont les seuils.
[43]:
W = numpy.zeros((X.shape[0], len(th) + 1))
x = X[:, 0]
W[:, 0] = x
for i in range(len(th)):
    W[x > th[i], i + 1] = x[x > th[i]]
[44]:
model = OLS(Y, W)
results = model.fit()
results.summary()
[44]:
| Dep. Variable: | y | R-squared (uncentered): | 0.858 |
|---|---|---|---|
| Model: | OLS | Adj. R-squared (uncentered): | 0.855 |
| Method: | Least Squares | F-statistic: | 370.4 |
| Date: | Mon, 07 Oct 2024 | Prob (F-statistic): | 0.00 |
| Time: | 11:29:07 | Log-Likelihood: | -1637.5 |
| No. Observations: | 1000 | AIC: | 3307. |
| Df Residuals: | 984 | BIC: | 3385. |
| Df Model: | 16 | ||
| Covariance Type: | nonrobust |
| coef | std err | t | P>|t| | [0.025 | 0.975] | |
|---|---|---|---|---|---|---|
| x1 | -1.8183 | 0.119 | -15.303 | 0.000 | -2.051 | -1.585 |
| x2 | -0.4155 | 0.260 | -1.600 | 0.110 | -0.925 | 0.094 |
| x3 | 0.2157 | 0.320 | 0.673 | 0.501 | -0.413 | 0.845 |
| x4 | 0.1368 | 0.247 | 0.553 | 0.581 | -0.349 | 0.622 |
| x5 | -0.2634 | 0.166 | -1.589 | 0.112 | -0.589 | 0.062 |
| x6 | 1.0105 | 0.196 | 5.164 | 0.000 | 0.627 | 1.395 |
| x7 | 3.3282 | 0.356 | 9.357 | 0.000 | 2.630 | 4.026 |
| x8 | 1.3866 | 0.454 | 3.051 | 0.002 | 0.495 | 2.278 |
| x9 | 0.3655 | 0.403 | 0.907 | 0.365 | -0.425 | 1.156 |
| x10 | 0.1177 | 0.334 | 0.353 | 0.724 | -0.537 | 0.773 |
| x11 | -0.3147 | 0.307 | -1.023 | 0.306 | -0.918 | 0.289 |
| x12 | 0.2972 | 0.255 | 1.166 | 0.244 | -0.203 | 0.797 |
| x13 | -0.0456 | 0.197 | -0.231 | 0.817 | -0.433 | 0.342 |
| x14 | 0.2807 | 0.252 | 1.112 | 0.266 | -0.215 | 0.776 |
| x15 | -0.3102 | 0.303 | -1.024 | 0.306 | -0.904 | 0.284 |
| x16 | -0.0231 | 0.237 | -0.097 | 0.923 | -0.489 | 0.443 |
| Omnibus: | 207.506 | Durbin-Watson: | 1.993 |
|---|---|---|---|
| Prob(Omnibus): | 0.000 | Jarque-Bera (JB): | 673.510 |
| Skew: | -0.999 | Prob(JB): | 5.61e-147 |
| Kurtosis: | 6.489 | Cond. No. | 37.1 |
Notes:
[1] R² is computed without centering (uncentered) since the model does not contain a constant.
[2] Standard Errors assume that the covariance matrix of the errors is correctly specified.
Dessinons les résultats de la prédictions.
[45]:
yp = results.predict(W)
fig, ax = plt.subplots(1, 1)
ax.plot(X[:, 0], Y, ".", label="expected")
ax.plot(X[:, 0], yp, ".", label="predicted")
ax.legend()
ax.set_title(
    "Régression linéaire par morceaux\nsur un nuage linéaire par morceaux\nR2=%f"
    % results.rsquared
);
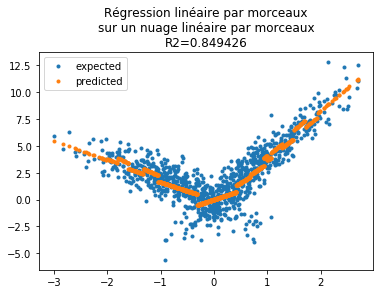
Le modèle nous suggère de ne garder que quelques seuils. En s’appuyant sur les p-values :
[46]:
keep = numpy.arange(len(results.pvalues))[results.pvalues < 0.05]
keep
[46]:
array([0, 5, 6, 7])
[47]:
W2 = W[:, keep]
[48]:
model = OLS(Y, W2)
results = model.fit()
results.summary()
[48]:
| Dep. Variable: | y | R-squared (uncentered): | 0.856 |
|---|---|---|---|
| Model: | OLS | Adj. R-squared (uncentered): | 0.855 |
| Method: | Least Squares | F-statistic: | 1481. |
| Date: | Mon, 07 Oct 2024 | Prob (F-statistic): | 0.00 |
| Time: | 11:29:08 | Log-Likelihood: | -1642.9 |
| No. Observations: | 1000 | AIC: | 3294. |
| Df Residuals: | 996 | BIC: | 3314. |
| Df Model: | 4 | ||
| Covariance Type: | nonrobust |
| coef | std err | t | P>|t| | [0.025 | 0.975] | |
|---|---|---|---|---|---|---|
| x1 | -1.9657 | 0.062 | -31.604 | 0.000 | -2.088 | -1.844 |
| x2 | 0.8316 | 0.163 | 5.106 | 0.000 | 0.512 | 1.151 |
| x3 | 3.3282 | 0.355 | 9.363 | 0.000 | 2.631 | 4.026 |
| x4 | 1.7842 | 0.327 | 5.455 | 0.000 | 1.142 | 2.426 |
| Omnibus: | 225.520 | Durbin-Watson: | 2.011 |
|---|---|---|---|
| Prob(Omnibus): | 0.000 | Jarque-Bera (JB): | 775.424 |
| Skew: | -1.066 | Prob(JB): | 4.16e-169 |
| Kurtosis: | 6.750 | Cond. No. | 17.4 |
Notes:
[1] R² is computed without centering (uncentered) since the model does not contain a constant.
[2] Standard Errors assume that the covariance matrix of the errors is correctly specified.
[49]:
yp = results.predict(W2)
fig, ax = plt.subplots(1, 1)
ax.plot(X[:, 0], Y, ".", label="expected")
ax.plot(X[:, 0], yp, ".", label="predicted")
ax.legend()
ax.set_title(
    "Régression linéaire par morceaux\nsur un nuage linéaire par morceaux\n"
    + "réduction du nombre de segments\nR2=%f" % results.rsquared
);
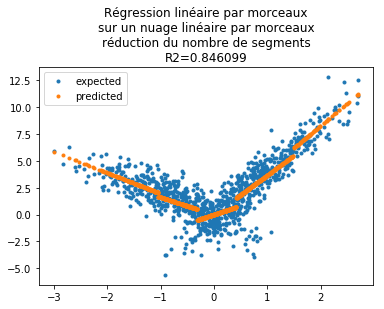
Le coefficient est quasiment identique pour un nombre de segments moindre. Je me suis amusé à rendre ce code plus générique pour comparer la première étape, le découpage en morceaux, via deux modèles, un arbre de décision et le nouvel objet KBinsDiscretizer qui segmente une variable sans tenir compte de la cible. La régression n’est plus nécessaire linéaire : Piecewise linear
regression. Je me suis également amusé à faire de même pour une classification par morceaux PiecewiseClassifier. Celle-ci pose quelques soucis pratiques car toutes les classes ne sont pas forcément représentées dans chaque compartiment…
[41]: