Completion profiling
Profiling avec cProfile, memory_profiler, pyinstrument, snakeviz.
line_profiler ne semble pas plus être maintenu.
[1]:
%matplotlib inline
Setup
Function to profile
[2]:
from mlstatpy.nlp.completion import CompletionTrieNode


def gain_dynamique_moyen_par_mot(queries, weights):
    per = list(zip(weights, queries))
    total = sum(weights) * 1.0
    trie = CompletionTrieNode.build([(None, q) for _, q in per])
    trie.precompute_stat()
    trie.update_stat_dynamic()
    wks = [(w, p, len(w) - trie.min_keystroke0(w)[0]) for p, w in per]
    wks_dyn = [(w, p, len(w) - trie.min_dynamic_keystroke(w)[0]) for p, w in per]
    wks_dyn2 = [(w, p, len(w) - trie.min_dynamic_keystroke2(w)[0]) for p, w in per]
    gain = sum(g * p / total for w, p, g in wks)
    gain_dyn = sum(g * p / total for w, p, g in wks_dyn)
    gain_dyn2 = sum(g * p / total for w, p, g in wks_dyn2)
    ave_length = sum(len(w) * p / total for p, w in per)
    return gain, gain_dyn, gain_dyn2, ave_length
Data
[3]:
from mlstatpy.data.wikipedia import download_titles

file_titles = download_titles(country="fr")
[4]:
len(file_titles)
[4]:
33
[5]:
from mlstatpy.data.wikipedia import enumerate_titles

list_titles = list(
    sorted(set(_ for _ in enumerate_titles(file_titles) if "A" <= _[0] <= "Z"))
)
[6]:
import random

sample1000 = random.sample(list_titles, 1000)
with open("sample1000.txt", "w", encoding="utf-8") as f:
    f.write("\n".join(sample1000))
Standard modules
cProfile
[7]:
import cProfile, io, pstats, os


def toprofile0(lines):
    gain_dynamique_moyen_par_mot(lines, [1.0] * len(lines))


def doprofile(lines, filename):
    pr = cProfile.Profile()
    pr.enable()
    toprofile0(lines)
    pr.disable()
    s = io.StringIO()
    ps = pstats.Stats(pr, stream=s).sort_stats("cumulative")
    ps.print_stats()
    rem = os.path.normpath(os.path.join(os.getcwd(), "..", "..", ".."))
    res = s.getvalue().replace(rem, "")
    ps.dump_stats(filename)
    return res
[8]:
r = doprofile(sample1000, "completion.prof")
print(r)
         1289418 function calls in 1.487 seconds

   Ordered by: cumulative time

   ncalls  tottime  percall  cumtime  percall filename:lineno(function)
        1    0.000    0.000    1.487    1.487 /tmp/ipykernel_54937/4045418276.py:4(toprofile0)
        1    0.075    0.075    1.487    1.487 /tmp/ipykernel_54937/1707536480.py:4(gain_dynamique_moyen_par_mot)
        1    0.314    0.314    1.107    1.107 /mlstatpy/nlp/completion.py:442(precompute_stat)
    16034    0.167    0.000    0.652    0.000 /mlstatpy/nlp/completion.py:531(merge_completions)
    16034    0.308    0.000    0.319    0.000 {built-in method builtins.__build_class__}
        1    0.055    0.055    0.204    0.204 /mlstatpy/nlp/completion.py:477(update_stat_dynamic)
    36051    0.081    0.000    0.094    0.000 /mlstatpy/nlp/completion.py:554(<listcomp>)
    17034    0.046    0.000    0.088    0.000 /mlstatpy/nlp/completion.py:594(update_dynamic_minimum_keystroke)
        1    0.045    0.045    0.075    0.075 /mlstatpy/nlp/completion.py:205(build)
    35841    0.021    0.000    0.044    0.000 {built-in method builtins.all}
   309964    0.041    0.000    0.041    0.000 {built-in method builtins.len}
    17034    0.030    0.000    0.034    0.000 /mlstatpy/nlp/completion.py:627(second_step)
    16034    0.023    0.000    0.029    0.000 /mlstatpy/nlp/completion.py:581(update_minimum_keystroke)
    16035    0.006    0.000    0.028    0.000 {method 'extend' of 'collections.deque' objects}
    17035    0.018    0.000    0.028    0.000 /mlstatpy/nlp/completion.py:90(unsorted_iter)
    97520    0.027    0.000    0.027    0.000 /mlstatpy/nlp/completion.py:462(<genexpr>)
    16034    0.017    0.000    0.023    0.000 {built-in method builtins.sorted}
     1001    0.014    0.000    0.021    0.000 /mlstatpy/nlp/completion.py:126(leaves)
   110289    0.019    0.000    0.019    0.000 {built-in method builtins.hasattr}
    17034    0.017    0.000    0.019    0.000 /mlstatpy/nlp/completion.py:664(init_dynamic_minimum_keystroke)
    17034    0.015    0.000    0.018    0.000 /mlstatpy/nlp/completion.py:15(__init__)
   116511    0.016    0.000    0.016    0.000 {method 'values' of 'dict' objects}
    52086    0.015    0.000    0.015    0.000 {method 'append' of 'list' objects}
      500    0.005    0.000    0.014    0.000 ~/vv/this/lib/python3.10/site-packages/ipykernel/ipkernel.py:775(_clean_thread_parent_frames)
     3000    0.013    0.000    0.013    0.000 /mlstatpy/nlp/completion.py:263(find)
    23123    0.010    0.000    0.010    0.000 {built-in method builtins.min}
    48102    0.009    0.000    0.009    0.000 {method 'extend' of 'list' objects}
    54873    0.008    0.000    0.008    0.000 {method 'popleft' of 'collections.deque' objects}
        1    0.001    0.001    0.008    0.008 /tmp/ipykernel_54937/1707536480.py:10(<listcomp>)
        1    0.001    0.001    0.008    0.008 /tmp/ipykernel_54937/1707536480.py:11(<listcomp>)
    20017    0.008    0.000    0.008    0.000 {built-in method builtins.max}
    17033    0.007    0.000    0.007    0.000 /mlstatpy/nlp/completion.py:48(_add)
        1    0.001    0.001    0.007    0.007 /tmp/ipykernel_54937/1707536480.py:12(<listcomp>)
     1000    0.001    0.000    0.007    0.000 /mlstatpy/nlp/completion.py:328(min_keystroke0)
     1000    0.002    0.000    0.007    0.000 /mlstatpy/nlp/completion.py:364(min_dynamic_keystroke)
      250    0.002    0.000    0.007    0.000 ~/vv/this/lib/python3.10/site-packages/ipykernel/ipkernel.py:790(<setcomp>)
    16034    0.007    0.000    0.007    0.000 /mlstatpy/nlp/completion.py:541(<listcomp>)
    36840    0.007    0.000    0.007    0.000 {method 'append' of 'collections.deque' objects}
     1000    0.001    0.000    0.006    0.000 /mlstatpy/nlp/completion.py:400(min_dynamic_keystroke2)
    16034    0.006    0.000    0.006    0.000 /mlstatpy/nlp/completion.py:537(Fake)
    51102    0.006    0.000    0.006    0.000 {method 'pop' of 'list' objects}
    17034    0.006    0.000    0.006    0.000 /mlstatpy/nlp/completion.py:547(<genexpr>)
     1750    0.004    0.000    0.004    0.000 /usr/lib/python3.10/threading.py:1145(ident)
    32068    0.003    0.000    0.003    0.000 {method 'items' of 'dict' objects}
    18534    0.003    0.000    0.003    0.000 {built-in method builtins.isinstance}
      250    0.002    0.000    0.003    0.000 /usr/lib/python3.10/threading.py:1478(enumerate)
        5    0.000    0.000    0.002    0.000 {built-in method builtins.sum}
        1    0.000    0.000    0.000    0.000 /tmp/ipykernel_54937/1707536480.py:7(<listcomp>)
     1001    0.000    0.000    0.000    0.000 /tmp/ipykernel_54937/1707536480.py:16(<genexpr>)
     1001    0.000    0.000    0.000    0.000 /tmp/ipykernel_54937/1707536480.py:13(<genexpr>)
      250    0.000    0.000    0.000    0.000 {method '__exit__' of '_thread.RLock' objects}
     1000    0.000    0.000    0.000    0.000 {method 'keys' of 'dict' objects}
     1001    0.000    0.000    0.000    0.000 /tmp/ipykernel_54937/1707536480.py:14(<genexpr>)
     1001    0.000    0.000    0.000    0.000 /tmp/ipykernel_54937/1707536480.py:15(<genexpr>)
        1    0.000    0.000    0.000    0.000 {method 'disable' of '_lsprof.Profiler' objects}
Others informations when profiling
memory_profiler
See memory_profiler. Version 0.56 is bugged (see #258).
[10]:
from memory_profiler import profile

%load_ext memory_profiler
[11]:
%memit toprofile0(sample1000)
peak memory: 547.55 MiB, increment: 0.00 MiB
[12]:
from io import StringIO

st = StringIO()


@profile(stream=st)
def toprofile(lines):
    gain_dynamique_moyen_par_mot(lines, [1.0] * len(lines))


toprofile(sample1000)
ERROR: Could not find file /tmp/ipykernel_54937/1913397401.py
[13]:
%%file temp_mem_profile.py

from mlstatpy.nlp.completion import CompletionTrieNode
from memory_profiler import profile


@profile(precision=4)
def gain_dynamique_moyen_par_mot(queries, weights):
    per = list(zip(weights, queries))
    total = sum(weights) * 1.0
    res = []
    trie = CompletionTrieNode.build([(None, q) for _, q in per])
    trie.precompute_stat()
    trie.update_stat_dynamic()
    wks = [(w, p, len(w) - trie.min_keystroke0(w)[0]) for p, w in per]
    wks_dyn = [(w, p, len(w) - trie.min_dynamic_keystroke(w)[0]) for p, w in per]
    wks_dyn2 = [(w, p, len(w) - trie.min_dynamic_keystroke2(w)[0]) for p, w in per]
    gain = sum(g * p / total for w, p, g in wks)
    gain_dyn = sum(g * p / total for w, p, g in wks_dyn)
    gain_dyn2 = sum(g * p / total for w, p, g in wks_dyn2)
    ave_length = sum(len(w) * p / total for p, w in per)
    return gain, gain_dyn, gain_dyn2, ave_length


@profile(precision=4)
def toprofile():
    with open("sample1000.txt", "r", encoding="utf-8") as f:
        lines = [_.strip("\n\r ") for _ in f.readlines()]
    gain_dynamique_moyen_par_mot(lines, [1.0] * len(lines))


toprofile()
Writing temp_mem_profile.py
[14]:
import sys

cmd = sys.executable
from sphinx_runpython.runpython import run_cmd

cmd += " -m memory_profiler temp_mem_profile.py"
out, err = run_cmd(cmd, wait=True)
print(out)
Filename: temp_mem_profile.py

Line #    Mem usage    Increment  Occurrences   Line Contents
=============================================================
     6  45.8438 MiB  45.8438 MiB           1   @profile(precision=4)
     7                                         def gain_dynamique_moyen_par_mot(queries, weights):
     8  45.8438 MiB   0.0000 MiB           1       per = list(zip(weights, queries))
     9  45.8438 MiB   0.0000 MiB           1       total = sum(weights) * 1.0
    10  45.8438 MiB   0.0000 MiB           1       res = []
    11  52.5469 MiB   6.7031 MiB        1003       trie = CompletionTrieNode.build([(None, q) for _, q in per])
    12  60.0234 MiB   7.4766 MiB           1       trie.precompute_stat()
    13  69.5625 MiB   9.5391 MiB           1       trie.update_stat_dynamic()
    14  69.5625 MiB   0.0000 MiB        1003       wks = [(w, p, len(w) - trie.min_keystroke0(w)[0]) for p, w in per]
    15  69.5625 MiB   0.0000 MiB        1003       wks_dyn = [(w, p, len(w) - trie.min_dynamic_keystroke(w)[0]) for p, w in per]
    16  69.5625 MiB   0.0000 MiB        1003       wks_dyn2 = [(w, p, len(w) - trie.min_dynamic_keystroke2(w)[0]) for p, w in per]
    17  69.5625 MiB   0.0000 MiB        2003       gain = sum(g * p / total for w, p, g in wks)
    18  69.5625 MiB   0.0000 MiB        2003       gain_dyn = sum(g * p / total for w, p, g in wks_dyn)
    19  69.5625 MiB   0.0000 MiB        2003       gain_dyn2 = sum(g * p / total for w, p, g in wks_dyn2)
    20  69.5625 MiB   0.0000 MiB        2003       ave_length = sum(len(w) * p / total for p, w in per)
    21  69.5625 MiB   0.0000 MiB           1       return gain, gain_dyn, gain_dyn2, ave_length


Filename: temp_mem_profile.py

Line #    Mem usage    Increment  Occurrences   Line Contents
=============================================================
    24  45.5859 MiB  45.5859 MiB           1   @profile(precision=4)
    25                                         def toprofile():
    26  45.8438 MiB   0.0000 MiB           2       with open("sample1000.txt", "r", encoding="utf-8") as f:
    27  45.8438 MiB   0.2578 MiB        1003           lines = [_.strip("\n\r ") for _ in f.readlines()]
    28  69.5625 MiB  23.7188 MiB           1       gain_dynamique_moyen_par_mot(lines, [1.0] * len(lines))
Static Visualization
pyinstrument
See pyinstrument.
[16]:
from pyinstrument import Profiler

profiler = Profiler()
profiler.start()

toprofile0(sample1000)

profiler.stop()
out = profiler.output_text(unicode=False, color=False)
print(out.replace("\\", "/"))
  _     ._   __/__   _ _  _  _ _/_   Recorded: 12:44:24  Samples:  862
 /_//_/// /_/ / //_// / //_'/ //     Duration: 1.340     CPU time: 1.345
/   _/                      v4.7.3

Profile at /tmp/ipykernel_54937/259320473.py:4

1.338 ZMQInteractiveShell.run_ast_nodes  IPython/core/interactiveshell.py:3418
`- 1.337 <module>  ../../../tmp/ipykernel_54937/259320473.py:1
   `- 1.337 toprofile0  ../../../tmp/ipykernel_54937/4045418276.py:4
      `- 1.337 gain_dynamique_moyen_par_mot  ../../../tmp/ipykernel_54937/1707536480.py:4
         |- 0.683 CompletionTrieNode.precompute_stat  mlstatpy/nlp/completion.py:442
         |  |- 0.467 _Stat.merge_completions  mlstatpy/nlp/completion.py:531
         |  |  |- 0.236 [self]  mlstatpy/nlp/completion.py
         |  |  |- 0.110 __build_class__  <built-in>
         |  |  `- 0.076 <listcomp>  mlstatpy/nlp/completion.py:554
         |  |     `- 0.068 [self]  mlstatpy/nlp/completion.py
         |  |- 0.126 [self]  mlstatpy/nlp/completion.py
         |  |- 0.025 _Stat.update_minimum_keystroke  mlstatpy/nlp/completion.py:581
         |  |  `- 0.020 [self]  mlstatpy/nlp/completion.py
         |  |- 0.022 <genexpr>  mlstatpy/nlp/completion.py:462
         |  `- 0.016 CompletionTrieNode.leaves  mlstatpy/nlp/completion.py:126
         |- 0.408 build  mlstatpy/nlp/completion.py:205
         |  |- 0.382 [self]  mlstatpy/nlp/completion.py
         |  `- 0.014 CompletionTrieNode.__init__  mlstatpy/nlp/completion.py:15
         `- 0.220 CompletionTrieNode.update_stat_dynamic  mlstatpy/nlp/completion.py:477
            |- 0.104 int.update_dynamic_minimum_keystroke  mlstatpy/nlp/completion.py:594
            |  |- 0.057 [self]  mlstatpy/nlp/completion.py
            |  `- 0.041 second_step  mlstatpy/nlp/completion.py:627
            |     `- 0.037 [self]  mlstatpy/nlp/completion.py
            |- 0.055 [self]  mlstatpy/nlp/completion.py
            |- 0.024 CompletionTrieNode.unsorted_iter  mlstatpy/nlp/completion.py:90
            |  `- 0.017 [self]  mlstatpy/nlp/completion.py
            `- 0.023 _Stat.init_dynamic_minimum_keystroke  mlstatpy/nlp/completion.py:664
               `- 0.022 [self]  mlstatpy/nlp/completion.py
Javascript Visualization
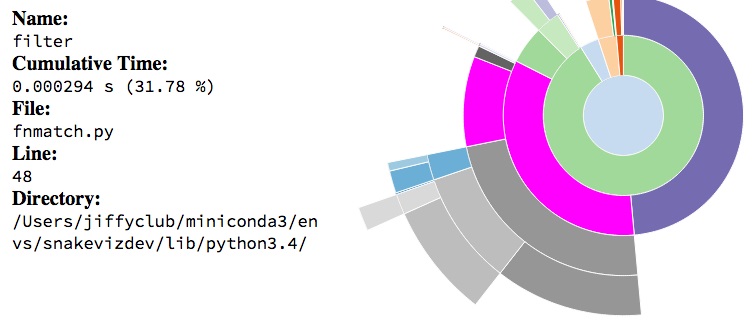
SnakeViz
[17]:
%load_ext snakeviz
L’instruction qui suit lance l’explorateur par défaut avec les données du profilage.
[16]:
# %snakeviz toprofile0(sample1000)
[19]:
from IPython.display import Image

Image("images/func_info.jpg", width=400)
[19]:
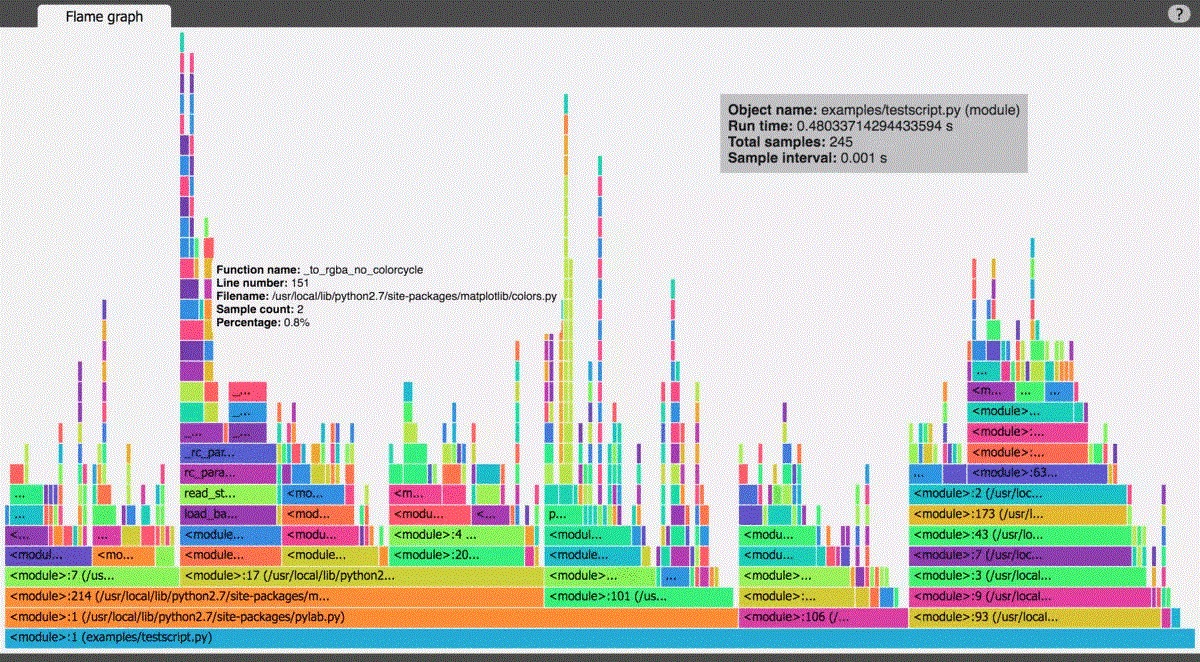
vprof, py-spy
See vprof or py-spy. The second one outputs a SVG file easy to handle.
[18]:
# from vprof import profiler

# needs to be run from a file not from a notebook
# profiler.run(toprofile0, 'cmh', args=(sample1000,), host='localhost', port=8000)
[20]:
from IPython.display import Image

Image("images/vprof.jpg", width=800)
[20]:
[20]: