ROC
A few graphs about ROC on the iris datasets.
[1]:
%matplotlib inline
import matplotlib.pyplot as plt
Iris datasets
[3]:
from sklearn import datasets

iris = datasets.load_iris()
X = iris.data[:, :2]
y = iris.target
[4]:
from sklearn.model_selection import train_test_split

X_train, X_test, y_train, y_test = train_test_split(X, y, test_size=0.33)
[5]:
from sklearn.linear_model import LogisticRegression

clf = LogisticRegression()
clf.fit(X_train, y_train)
[5]:
LogisticRegression(C=1.0, class_weight=None, dual=False, fit_intercept=True,
          intercept_scaling=1, max_iter=100, multi_class='ovr', n_jobs=1,
          penalty='l2', random_state=None, solver='liblinear', tol=0.0001,
          verbose=0, warm_start=False)
[6]:
import numpy

ypred = clf.predict(X_test)
yprob = clf.predict_proba(X_test)
score = numpy.array(list(yprob[i, ypred[i]] for i in range(len(ypred))))
[7]:
data = numpy.zeros((len(ypred), 2))
data[:, 0] = score.ravel()
data[ypred == y_test, 1] = 1
data[:5]
[7]:
array([[ 0.70495209,  1.        ],
       [ 0.56148737,  0.        ],
       [ 0.56148737,  1.        ],
       [ 0.77416227,  1.        ],
       [ 0.58631799,  0.        ]])
ROC with scikit-learn
We use the following example Receiver Operating Characteristic (ROC).
[8]:
from sklearn.metrics import roc_curve

fpr, tpr, th = roc_curve(y_test == ypred, score)
[9]:
plt.plot(fpr, tpr, label="ROC curve")
plt.plot([0, 1], [0, 1], linestyle="--")
plt.xlim([0.0, 1.0])
plt.ylim([0.0, 1.0])
plt.xlabel("False Positive Rate")
plt.ylabel("True Positive Rate")
plt.legend(loc="lower right")
[9]:
<matplotlib.legend.Legend at 0x268373a2128>

[10]:
import pandas

df = pandas.DataFrame(dict(fpr=fpr, tpr=tpr, threshold=th))
df
[10]:
| fpr | threshold | tpr | |
|---|---|---|---|
| 0 | 0.000000 | 0.910712 | 0.032258 |
| 1 | 0.000000 | 0.869794 | 0.096774 |
| 2 | 0.000000 | 0.863174 | 0.161290 |
| 3 | 0.000000 | 0.805864 | 0.258065 |
| 4 | 0.000000 | 0.790909 | 0.387097 |
| 5 | 0.000000 | 0.650510 | 0.612903 |
| 6 | 0.052632 | 0.634499 | 0.612903 |
| 7 | 0.052632 | 0.620319 | 0.709677 |
| 8 | 0.105263 | 0.615015 | 0.709677 |
| 9 | 0.210526 | 0.607975 | 0.741935 |
| 10 | 0.210526 | 0.604496 | 0.774194 |
| 11 | 0.263158 | 0.586318 | 0.774194 |
| 12 | 0.263158 | 0.584172 | 0.806452 |
| 13 | 0.315789 | 0.561487 | 0.838710 |
| 14 | 0.421053 | 0.556499 | 0.838710 |
| 15 | 0.578947 | 0.525449 | 0.838710 |
| 16 | 0.578947 | 0.522579 | 0.870968 |
| 17 | 0.631579 | 0.522551 | 0.870968 |
| 18 | 0.684211 | 0.520835 | 0.903226 |
| 19 | 0.736842 | 0.516687 | 0.903226 |
| 20 | 0.736842 | 0.453826 | 0.967742 |
| 21 | 0.842105 | 0.417941 | 0.967742 |
| 22 | 0.842105 | 0.412703 | 1.000000 |
| 23 | 1.000000 | 0.375573 | 1.000000 |
ROC - TPR / FPR
We do the same with the class this module provides ROC.
TPR = True Positive Rate
FPR = False Positive Rate
You can see as TPR the distribution function of a score for a positive example and the FPR the same for a negative example.
[11]:
from mlstatpy.ml.roc import ROC
[12]:
roc = ROC(df=data)
[13]:
roc
[13]:
Overall precision: 0.63 - AUC=0.850594
--------------
      score  label  weight
0  0.375573    0.0     1.0
1  0.385480    0.0     1.0
2  0.412314    0.0     1.0
3  0.412703    1.0     1.0
4  0.417941    0.0     1.0
--------------
       score  label  weight
45  0.863174    1.0     1.0
46  0.863174    1.0     1.0
47  0.869794    1.0     1.0
48  0.903335    1.0     1.0
49  0.910712    1.0     1.0
--------------
    False Positive Rate  True Positive Rate  threshold
0              0.000000            0.032258   0.910712
1              0.000000            0.193548   0.828617
2              0.000000            0.354839   0.790909
3              0.000000            0.516129   0.737000
4              0.052632            0.645161   0.627589
5              0.157895            0.741935   0.607975
6              0.263158            0.838710   0.561487
7              0.526316            0.838710   0.542211
8              0.684211            0.903226   0.520835
9              0.842105            0.967742   0.417941
10             1.000000            1.000000   0.375573
--------------
       error  recall  threshold
0   0.000000    0.02   0.910712
1   0.000000    0.12   0.828617
2   0.000000    0.22   0.790909
3   0.000000    0.32   0.737000
4   0.047619    0.42   0.627589
5   0.115385    0.52   0.607975
6   0.161290    0.62   0.561487
7   0.277778    0.72   0.542211
8   0.317073    0.82   0.520835
9   0.347826    0.92   0.417941
10  0.380000    1.00   0.375573
[14]:
roc.auc()
[14]:
0.85059422750424452
[15]:
roc.plot(nb=10)
[15]:
<matplotlib.axes._subplots.AxesSubplot at 0x2683ff2b668>
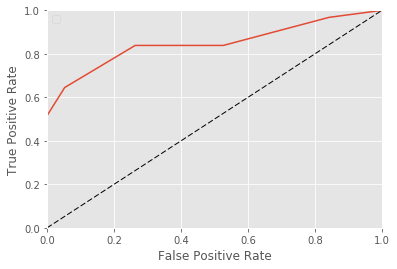
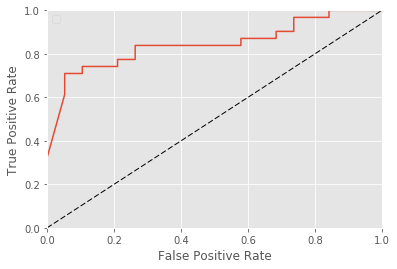
This function draws the curve with only 10 points but we can ask for more.
[16]:
roc.plot(nb=100)
[16]:
<matplotlib.axes._subplots.AxesSubplot at 0x2683feba240>
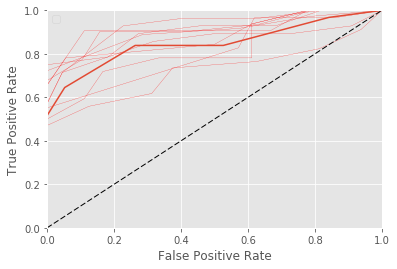
We can also ask to draw bootstropped curves to get a sense of the confidence.
[17]:
roc.plot(nb=10, bootstrap=10)
[17]:
<matplotlib.axes._subplots.AxesSubplot at 0x26840008748>
ROC - score distribution
This another representation for the metrics FPR and TPR.  is the probability that a score for a positive example to be less than
  .
.  is the probability that a score for a negative example to be higher than . We assume in this case that the higher the better for the score.
[18]:
roc.plot(curve=ROC.CurveType.PROBSCORE, thresholds=True)
[18]:
<matplotlib.axes._subplots.AxesSubplot at 0x268410618d0>
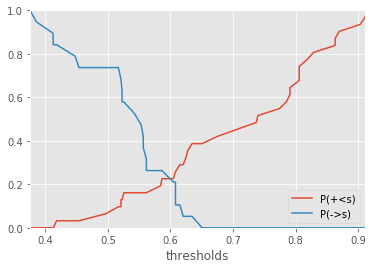
When curves intersects at score  , error rates for positive and negative examples are equal. If we show the confusion matrix for this particular score , it gives:
[19]:
conf = roc.confusion()
conf["P(+<s)"] = 1 - conf["True Positive"] / conf.loc[len(conf) - 1, "True Positive"]
conf["P(->s)"] = 1 - conf["True Negative"] / conf.loc[0, "True Negative"]
conf
[19]:
| True Positive | False Positive | False Negative | True Negative | threshold | P(+<s) | P(->s) | |
|---|---|---|---|---|---|---|---|
| 0 | 0.0 | 0.0 | 31.0 | 19.0 | 0.910712 | 1.000000 | 0.000000 |
| 1 | 1.0 | 0.0 | 30.0 | 19.0 | 0.910712 | 0.967742 | 0.000000 |
| 2 | 6.0 | 0.0 | 25.0 | 19.0 | 0.828617 | 0.806452 | 0.000000 |
| 3 | 11.0 | 0.0 | 20.0 | 19.0 | 0.790909 | 0.645161 | 0.000000 |
| 4 | 16.0 | 0.0 | 15.0 | 19.0 | 0.737000 | 0.483871 | 0.000000 |
| 5 | 20.0 | 1.0 | 11.0 | 18.0 | 0.627589 | 0.354839 | 0.052632 |
| 6 | 23.0 | 3.0 | 8.0 | 16.0 | 0.607975 | 0.258065 | 0.157895 |
| 7 | 26.0 | 5.0 | 5.0 | 14.0 | 0.561487 | 0.161290 | 0.263158 |
| 8 | 26.0 | 10.0 | 5.0 | 9.0 | 0.542211 | 0.161290 | 0.526316 |
| 9 | 28.0 | 13.0 | 3.0 | 6.0 | 0.520835 | 0.096774 | 0.684211 |
| 10 | 30.0 | 16.0 | 1.0 | 3.0 | 0.417941 | 0.032258 | 0.842105 |
| 11 | 31.0 | 19.0 | 0.0 | 0.0 | 0.375573 | 0.000000 | 1.000000 |
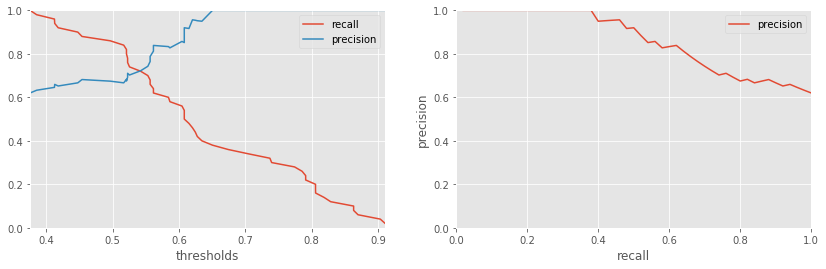
ROC - recall / precision
In this representation, we show the score.
[20]:
import matplotlib.pyplot as plt

fig, axes = plt.subplots(ncols=2, nrows=1, figsize=(14, 4))
roc.plot(curve=ROC.CurveType.RECPREC, thresholds=True, ax=axes[0])
roc.plot(curve=ROC.CurveType.RECPREC, ax=axes[1])
[20]:
<matplotlib.axes._subplots.AxesSubplot at 0x2684151d3c8>
[21]: