Note
Go to the end to download the full example code.
Piecewise linear regression with scikit-learn predictors
The notebook illustrates an implementation of a piecewise linear regression based on scikit-learn. The bucketization can be done with a DecisionTreeRegressor or a KBinsDiscretizer. A linear model is then fitted on each bucket.
Piecewise data
Let’s build a toy problem based on two linear models.
import numpy
import numpy.random as npr
import matplotlib.pyplot as plt
from sklearn.model_selection import train_test_split
from sklearn.tree import DecisionTreeRegressor
from sklearn.preprocessing import KBinsDiscretizer
from sklearn.dummy import DummyRegressor
from mlinsights.mlmodel import PiecewiseRegressor


X = npr.normal(size=(1000, 4))
alpha = [4, -2]
t = (X[:, 0] + X[:, 3] * 0.5) > 0
switch = numpy.zeros(X.shape[0])
switch[t] = 1
y = alpha[0] * X[:, 0] * t + alpha[1] * X[:, 0] * (1 - t) + X[:, 2]
fig, ax = plt.subplots(1, 1)
ax.plot(X[:, 0], y, ".")
ax.set_title("Piecewise examples")
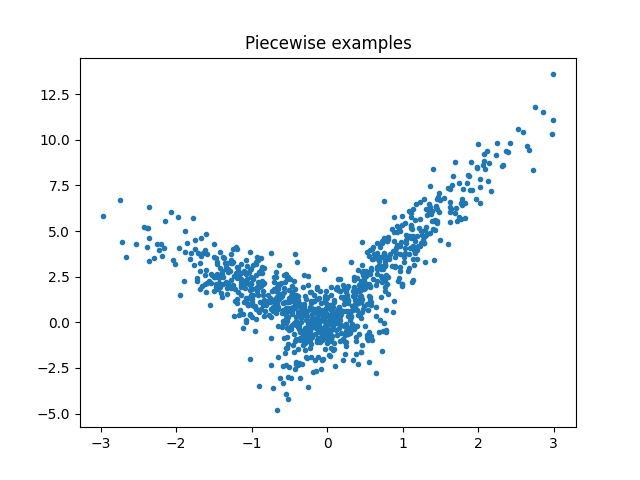
Text(0.5, 1.0, 'Piecewise examples')
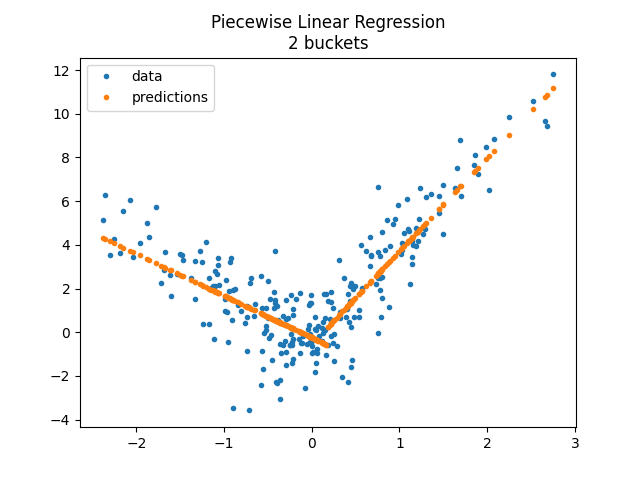
Piecewise Linear Regression with a decision tree
The first example is done with a decision tree.
model = PiecewiseRegressor(
    verbose=True, binner=DecisionTreeRegressor(min_samples_leaf=300)
)
model.fit(X_train, y_train)
[Parallel(n_jobs=1)]: Done 2 out of 2 | elapsed: 0.0s finished
array([1.28847674, 1.43183874, 1.1044673 , 0.26026944, 3.97500462])
<matplotlib.legend.Legend object at 0x79fb82a85760>
The method transform_bins returns the bucket of each variables, the final leave from the tree.
model.transform_bins(X_test)
array([1., 1., 0., 0., 1., 1., 1., 1., 1., 0., 0., 1., 0., 0., 1., 1., 1.,
       0., 1., 0., 1., 0., 0., 1., 0., 0., 0., 0., 1., 1., 0., 0., 0., 0.,
       1., 1., 1., 1., 0., 0., 0., 0., 0., 0., 1., 0., 0., 0., 1., 1., 0.,
       0., 0., 0., 0., 1., 0., 1., 1., 0., 0., 0., 0., 1., 1., 0., 1., 1.,
       1., 0., 0., 0., 0., 1., 0., 1., 0., 0., 0., 0., 1., 1., 0., 0., 0.,
       1., 1., 0., 1., 0., 1., 0., 0., 1., 0., 1., 0., 1., 0., 0., 0., 0.,
       0., 1., 0., 0., 0., 1., 1., 0., 0., 0., 0., 0., 0., 0., 0., 1., 0.,
       0., 0., 0., 1., 0., 1., 0., 0., 1., 1., 0., 1., 1., 0., 1., 0., 0.,
       0., 0., 1., 0., 1., 0., 0., 0., 1., 0., 1., 0., 1., 1., 0., 0., 0.,
       0., 0., 1., 1., 1., 1., 0., 0., 0., 0., 0., 0., 0., 1., 0., 1., 0.,
       0., 1., 0., 0., 0., 0., 1., 1., 0., 0., 0., 0., 0., 1., 1., 0., 0.,
       0., 1., 0., 1., 1., 1., 0., 1., 0., 1., 1., 0., 0., 1., 0., 1., 0.,
       0., 1., 0., 0., 1., 0., 1., 0., 0., 0., 1., 0., 0., 0., 0., 1., 1.,
       0., 0., 0., 1., 1., 1., 1., 1., 1., 0., 0., 1., 1., 0., 1., 1., 0.,
       0., 1., 0., 1., 1., 0., 0., 1., 0., 0., 1., 0.])
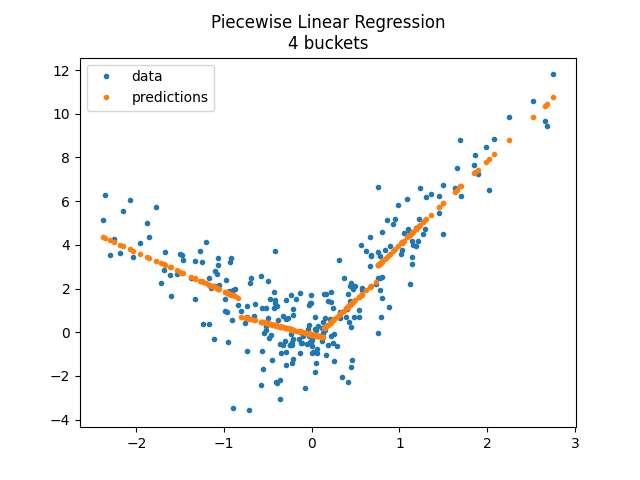
Let’s try with more buckets.
model = PiecewiseRegressor(
    verbose=False, binner=DecisionTreeRegressor(min_samples_leaf=150)
)
model.fit(X_train, y_train)
<matplotlib.legend.Legend object at 0x79fb829ff170>
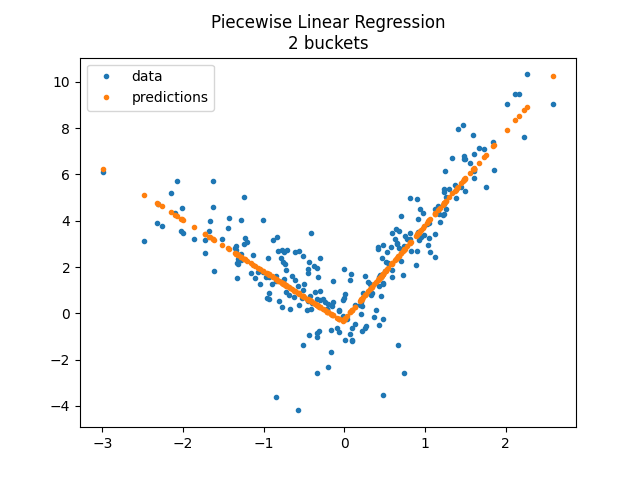
Piecewise Linear Regression with a KBinsDiscretizer
model = PiecewiseRegressor(verbose=True, binner=KBinsDiscretizer(n_bins=2))
model.fit(X_train, y_train)
~/vv/this312/lib/python3.12/site-packages/sklearn/preprocessing/_discretization.py:296: FutureWarning: The current default behavior, quantile_method='linear', will be changed to quantile_method='averaged_inverted_cdf' in scikit-learn version 1.9 to naturally support sample weight equivalence properties by default. Pass quantile_method='averaged_inverted_cdf' explicitly to silence this warning.
  warnings.warn(
[Parallel(n_jobs=1)]: Done   2 out of   2 | elapsed:    0.0s finished
<matplotlib.legend.Legend object at 0x79fb82ab5c10>
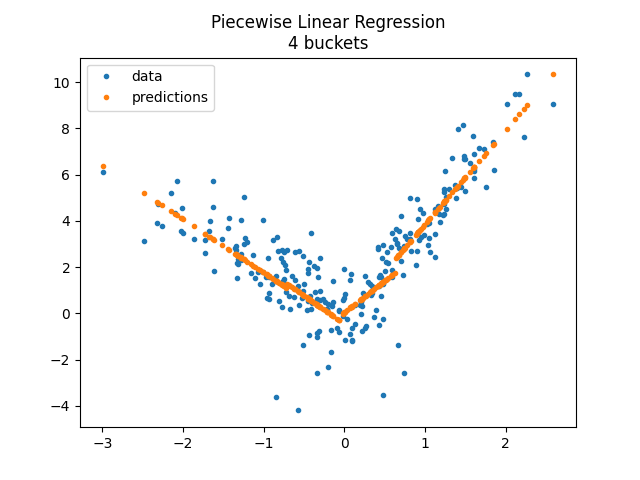
model = PiecewiseRegressor(verbose=True, binner=KBinsDiscretizer(n_bins=4))
model.fit(X_train, y_train)
~/vv/this312/lib/python3.12/site-packages/sklearn/preprocessing/_discretization.py:296: FutureWarning: The current default behavior, quantile_method='linear', will be changed to quantile_method='averaged_inverted_cdf' in scikit-learn version 1.9 to naturally support sample weight equivalence properties by default. Pass quantile_method='averaged_inverted_cdf' explicitly to silence this warning.
  warnings.warn(
[Parallel(n_jobs=1)]: Done   4 out of   4 | elapsed:    0.0s finished
<matplotlib.legend.Legend object at 0x79fb82960290>
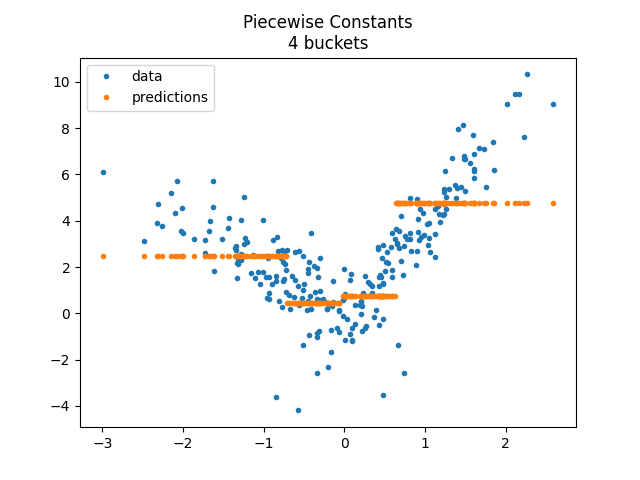
The model does not enforce continuity despite the fast it looks like so. Let’s compare with a constant on each bucket.
model = PiecewiseRegressor(
    verbose="tqdm", binner=KBinsDiscretizer(n_bins=4), estimator=DummyRegressor()
)
model.fit(X_train, y_train)
~/vv/this312/lib/python3.12/site-packages/sklearn/preprocessing/_discretization.py:296: FutureWarning: The current default behavior, quantile_method='linear', will be changed to quantile_method='averaged_inverted_cdf' in scikit-learn version 1.9 to naturally support sample weight equivalence properties by default. Pass quantile_method='averaged_inverted_cdf' explicitly to silence this warning.
  warnings.warn(

  0%|          | 0/4 [00:00<?, ?it/s]
100%|██████████| 4/4 [00:00<00:00, 2243.54it/s]
[Parallel(n_jobs=1)]: Done   4 out of   4 | elapsed:    0.0s finished
<matplotlib.legend.Legend object at 0x79fb829d75f0>
Next
# PR `Model trees (M5P and
# co) <https://github.com/scikit-learn/scikit-learn/issues/13106>`_ and
# issue `Model trees
# (M5P) <https://github.com/scikit-learn/scikit-learn/pull/13732>`_
# propose an implementation a piecewise regression with any kind of
# regression model. It is based on `Building Model
# Trees <https://github.com/ankonzoid/LearningX/tree/master/advanced_ML/model_tree%3E>`_.
# It fits many models to find the best splits.
Total running time of the script: (0 minutes 0.836 seconds)