Note
Go to the end to download the full example code.
Constraint KMeans
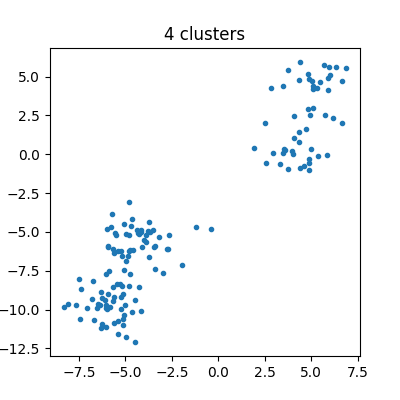
Simple example to show how to cluster keeping approximatively the same number of points in every cluster.
Data
from collections import Counter

import matplotlib.pyplot as plt
import numpy
from mlinsights.mlmodel import ConstraintKMeans
from sklearn.cluster import KMeans
from sklearn.datasets import make_blobs

n_samples = 100
data = make_blobs(
    n_samples=n_samples,
    n_features=2,
    centers=2,
    cluster_std=1.0,
    center_box=(-10.0, 0.0),
    shuffle=True,
    random_state=2,
)
X1 = data[0]
data = make_blobs(
    n_samples=n_samples // 2,
    n_features=2,
    centers=2,
    cluster_std=1.0,
    center_box=(0.0, 10.0),
    shuffle=True,
    random_state=2,
)
X2 = data[0]

X = numpy.vstack([X1, X2])
X.shape
(150, 2)
Plots.
fig, ax = plt.subplots(1, 1, figsize=(4, 4))
ax.plot(X[:, 0], X[:, 1], ".")
ax.set_title("4 clusters")
Text(0.5, 1.0, '4 clusters')
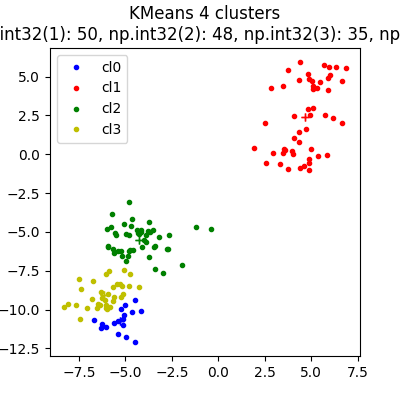
Standard KMeans
km = KMeans(n_clusters=4)
km.fit(X)
cl = km.predict(X)
hist = Counter(cl)

colors = "brgy"
fig, ax = plt.subplots(1, 1, figsize=(4, 4))
for i in range(max(cl) + 1):
    ax.plot(X[cl == i, 0], X[cl == i, 1], colors[i] + ".", label="cl%d" % i)
    x = [km.cluster_centers_[i, 0], km.cluster_centers_[i, 0]]
    y = [km.cluster_centers_[i, 1], km.cluster_centers_[i, 1]]
    ax.plot(x, y, colors[i] + "+")
ax.set_title(f"KMeans 4 clusters\n{hist!r}")
ax.legend()
<matplotlib.legend.Legend object at 0x79fb82be1b80>
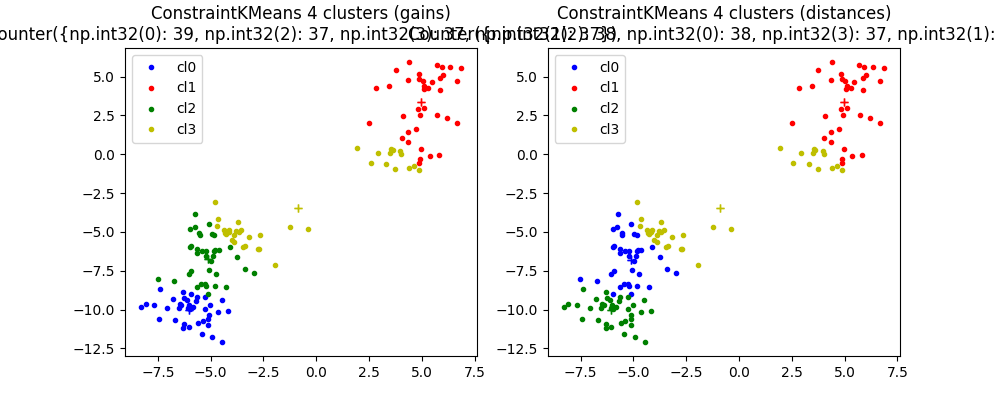
Constraint KMeans
km1 = ConstraintKMeans(n_clusters=4, strategy="gain", balanced_predictions=True)
km1.fit(X)

km2 = ConstraintKMeans(n_clusters=4, strategy="distance", balanced_predictions=True)
km2.fit(X)
This algorithm tries to exchange points between clusters.
fig, ax = plt.subplots(1, 2, figsize=(10, 4))
for i in range(max(cl1) + 1):
    ax[0].plot(X[cl1 == i, 0], X[cl1 == i, 1], colors[i] + ".", label="cl%d" % i)
    ax[1].plot(X[cl2 == i, 0], X[cl2 == i, 1], colors[i] + ".", label="cl%d" % i)
    x = [km1.cluster_centers_[i, 0], km1.cluster_centers_[i, 0]]
    y = [km1.cluster_centers_[i, 1], km1.cluster_centers_[i, 1]]
    ax[0].plot(x, y, colors[i] + "+")
    x = [km2.cluster_centers_[i, 0], km2.cluster_centers_[i, 0]]
    y = [km2.cluster_centers_[i, 1], km2.cluster_centers_[i, 1]]
    ax[1].plot(x, y, colors[i] + "+")
ax[0].set_title(f"ConstraintKMeans 4 clusters (gains)\n{hist1!r}")
ax[0].legend()
ax[1].set_title(f"ConstraintKMeans 4 clusters (distances)\n{hist2!r}")
ax[1].legend()
<matplotlib.legend.Legend object at 0x79fba0e82330>
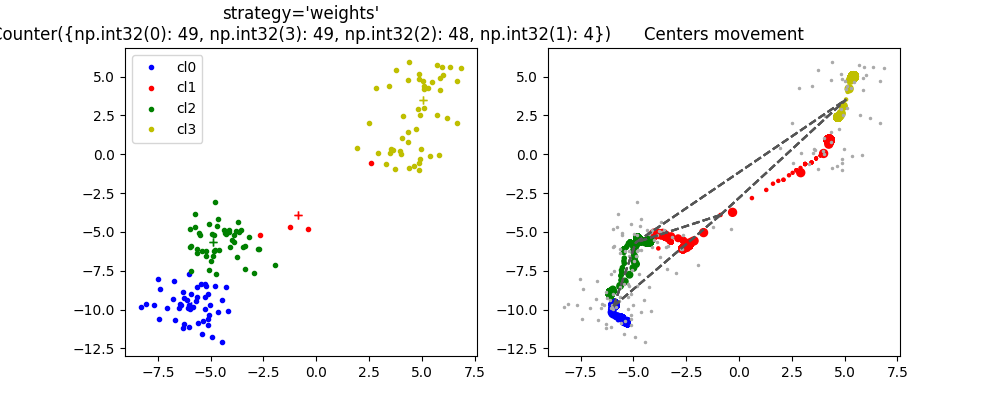
Another algorithm tries to extend the area of attraction of each cluster.
km = ConstraintKMeans(n_clusters=4, strategy="weights", max_iter=1000, history=True)
km.fit(X)

cl = km.predict(X)
hist = Counter(cl)
Let’s plot Delaunay edges as well.
def plot_delaunay(ax, edges, points):
    for a, b in edges:
        ax.plot(points[[a, b], 0], points[[a, b], 1], "--", color="#555555")


edges = km.cluster_edges()


fig, ax = plt.subplots(1, 2, figsize=(10, 4))
for i in range(max(cl) + 1):
    ax[0].plot(X[cl == i, 0], X[cl == i, 1], colors[i] + ".", label="cl%d" % i)
    x = [km.cluster_centers_[i, 0], km.cluster_centers_[i, 0]]
    y = [km.cluster_centers_[i, 1], km.cluster_centers_[i, 1]]
    ax[0].plot(x, y, colors[i] + "+")
ax[0].set_title(f"ConstraintKMeans 4 clusters\nstrategy='weights'\n{hist!r}")
ax[0].legend()

cls = km.cluster_centers_iter_
ax[1].plot(X[:, 0], X[:, 1], ".", label="X", color="#AAAAAA", ms=3)
for i in range(max(cl) + 1):
    ms = numpy.arange(cls.shape[-1]).astype(numpy.float64) / cls.shape[-1] * 50 + 1
    ax[1].scatter(cls[i, 0, :], cls[i, 1, :], color=colors[i], s=ms, label="cl%d" % i)
    plot_delaunay(ax[1], edges, km.cluster_centers_)
ax[1].set_title("Centers movement")
Text(0.5, 1.0, 'Centers movement')
Total running time of the script: (0 minutes 1.756 seconds)