Note
Go to the end to download the full example code.
Decision Tree and Logistic Regression
The notebook demonstrates the model DecisionTreeLogisticRegression which replaces the decision based on one variable by a logistic regression.
Iris dataset and logistic regression
The following code shows the border defined by two machine learning models on the Iris dataset.
import numpy
from scipy.spatial.distance import cdist
import matplotlib.pyplot as plt
from pandas import DataFrame
from tqdm import tqdm
from sklearn.datasets import load_iris
from sklearn.linear_model import LogisticRegression
from sklearn.model_selection import train_test_split
from sklearn.tree import DecisionTreeClassifier
from mlinsights.mlmodel import DecisionTreeLogisticRegression
from mlinsights.mltree import predict_leaves


def plot_classifier_decision_zone(clf, X, y, title=None, ax=None):
    if ax is None:
        ax = plt.gca()

    x_min, x_max = X[:, 0].min() - 1, X[:, 0].max() + 1
    y_min, y_max = X[:, 1].min() - 1, X[:, 1].max() + 1
    dhx = (x_max - x_min) / 100
    dhy = (y_max - y_min) / 100
    xx, yy = numpy.meshgrid(
        numpy.arange(x_min, x_max, dhx), numpy.arange(y_min, y_max, dhy)
    )

    Z = clf.predict(numpy.c_[xx.ravel(), yy.ravel()])
    Z = Z.reshape(xx.shape)

    ax.contourf(xx, yy, Z, alpha=0.5)
    ax.scatter(X[:, 0], X[:, 1], c=y, s=20, edgecolor="k", lw=0.5)
    if title is not None:
        ax.set_title(title)


iris = load_iris()
X = iris.data[:, [0, 2]]
y = iris.target
y = y % 2
X_train, X_test, y_train, y_test = train_test_split(X, y, test_size=0.6, shuffle=True)
lr = LogisticRegression()
lr.fit(X_train, y_train)
dt = DecisionTreeClassifier(criterion="entropy")
dt.fit(X_train, y_train)
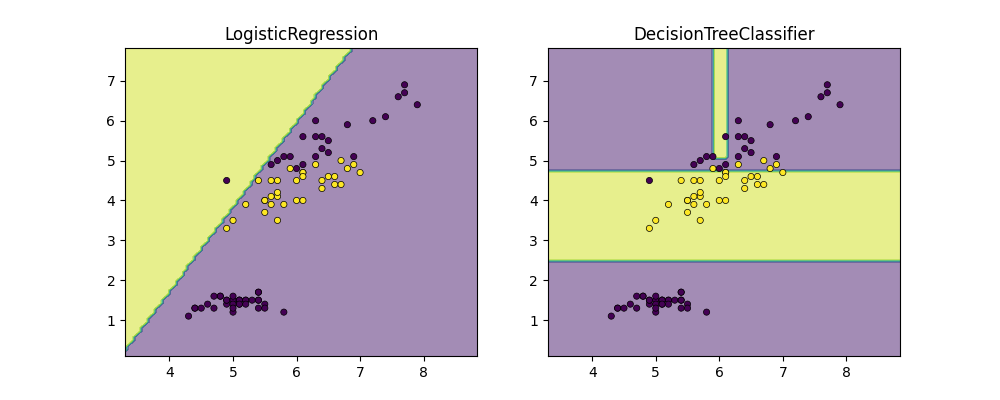
The logistic regression is not very stable on this sort of problem. No linear separator can work on this dataset. Let’s dig into it.
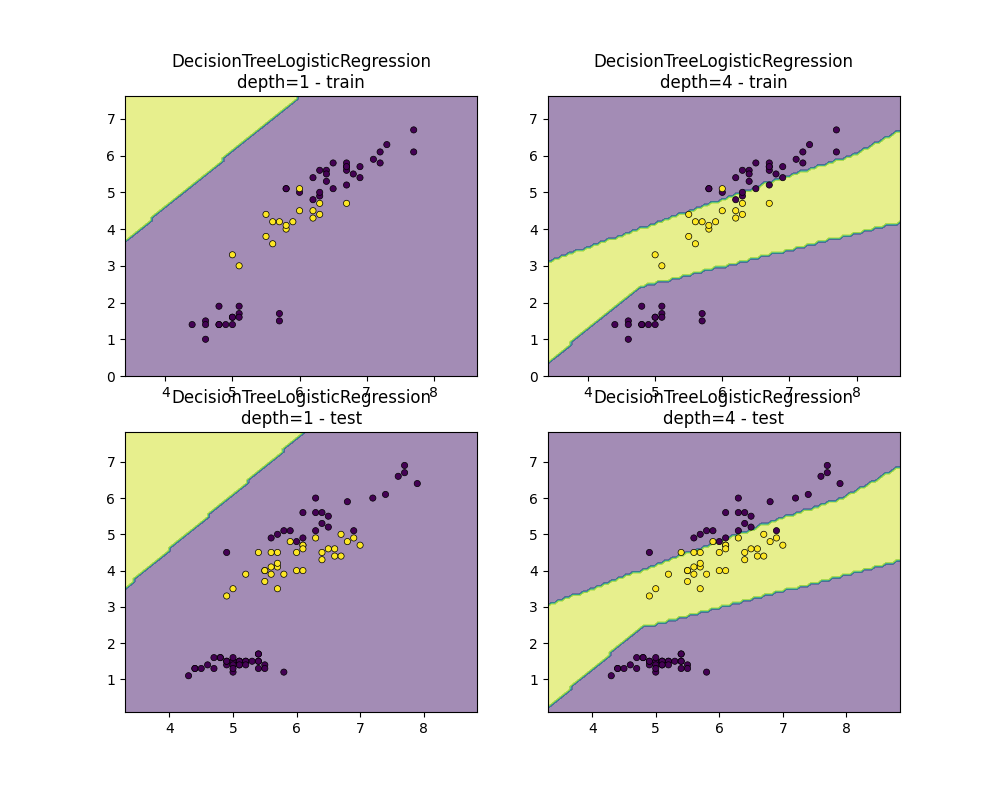
DecisionTreeLogisticRegression
dtlr = DecisionTreeLogisticRegression(
    estimator=LogisticRegression(solver="liblinear"),
    min_samples_leaf=10,
    min_samples_split=10,
    max_depth=1,
    fit_improve_algo="none",
)
dtlr.fit(X_train, y_train)
dtlr2 = DecisionTreeLogisticRegression(
    estimator=LogisticRegression(solver="liblinear"),
    min_samples_leaf=4,
    min_samples_split=4,
    max_depth=10,
    fit_improve_algo="intercept_sort_always",
)
dtlr2.fit(X_train, y_train)

fig, ax = plt.subplots(2, 2, figsize=(10, 8))
plot_classifier_decision_zone(
    dtlr,
    X_train,
    y_train,
    ax=ax[0, 0],
    title="DecisionTreeLogisticRegression\ndepth=%d - train" % dtlr.tree_depth_,
)
plot_classifier_decision_zone(
    dtlr2,
    X_train,
    y_train,
    ax=ax[0, 1],
    title="DecisionTreeLogisticRegression\ndepth=%d - train" % dtlr2.tree_depth_,
)
plot_classifier_decision_zone(
    dtlr,
    X_test,
    y_test,
    ax=ax[1, 0],
    title="DecisionTreeLogisticRegression\ndepth=%d - test" % dtlr.tree_depth_,
)
plot_classifier_decision_zone(
    dtlr2,
    X_test,
    y_test,
    ax=ax[1, 1],
    title="DecisionTreeLogisticRegression\ndepth=%d - test" % dtlr2.tree_depth_,
)
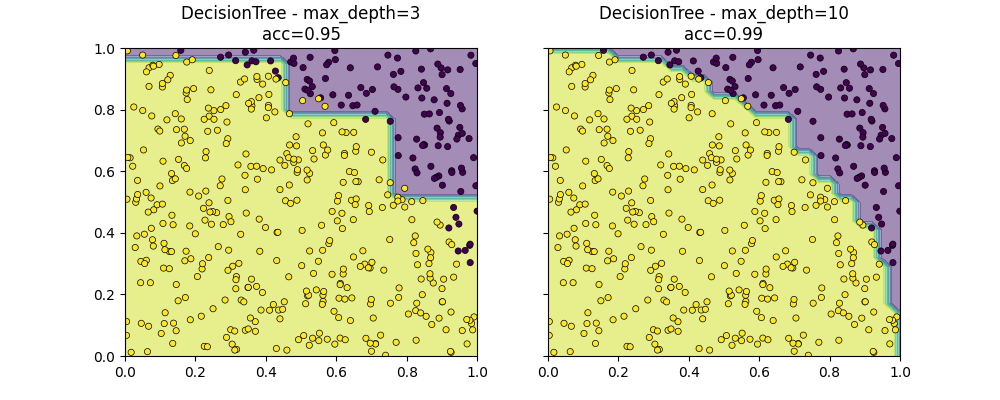
A first example
def random_set_simple(n):
    X = numpy.random.rand(n, 2)
    y = ((X[:, 0] ** 2 + X[:, 1] ** 2) <= 1).astype(numpy.int32).ravel()
    return X, y


X, y = random_set_simple(2000)
X_train, X_test, y_train, y_test = train_test_split(X, y)
dt = DecisionTreeClassifier(max_depth=3)
dt.fit(X_train, y_train)
dt8 = DecisionTreeClassifier(max_depth=10)
dt8.fit(X_train, y_train)
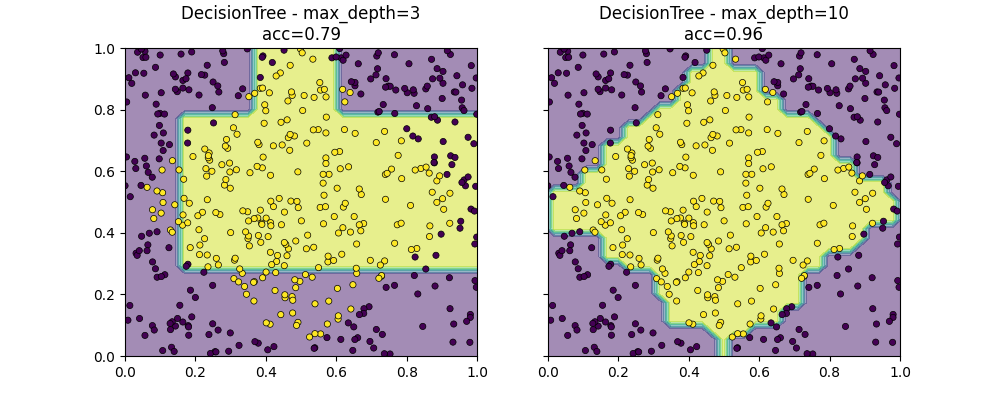
fig, ax = plt.subplots(1, 2, figsize=(10, 4), sharey=True)
plot_classifier_decision_zone(
dt,
X_test,
y_test,
ax=ax[0],
title="DecisionTree - max_depth=%d\nacc=%1.2f"
% (dt.max_depth, dt.score(X_test, y_test)),
)
plot_classifier_decision_zone(
dt8,
X_test,
y_test,
ax=ax[1],
title="DecisionTree - max_depth=%d\nacc=%1.2f"
% (dt8.max_depth, dt8.score(X_test, y_test)),
)
ax[0].set_xlim([0, 1])
ax[1].set_xlim([0, 1])
ax[0].set_ylim([0, 1])
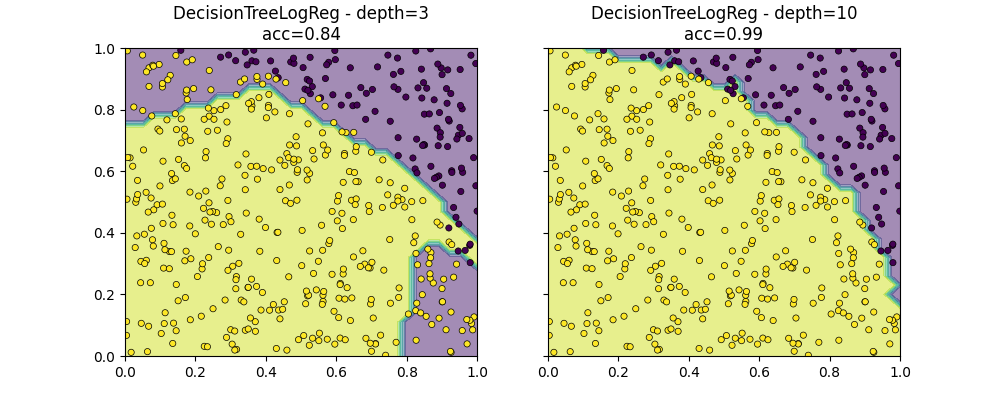
dtlr = DecisionTreeLogisticRegression(
max_depth=3, fit_improve_algo="intercept_sort_always", verbose=1
)
dtlr.fit(X_train, y_train)
dtlr8 = DecisionTreeLogisticRegression(
max_depth=10, min_samples_split=4, fit_improve_algo="intercept_sort_always"
)
dtlr8.fit(X_train, y_train)
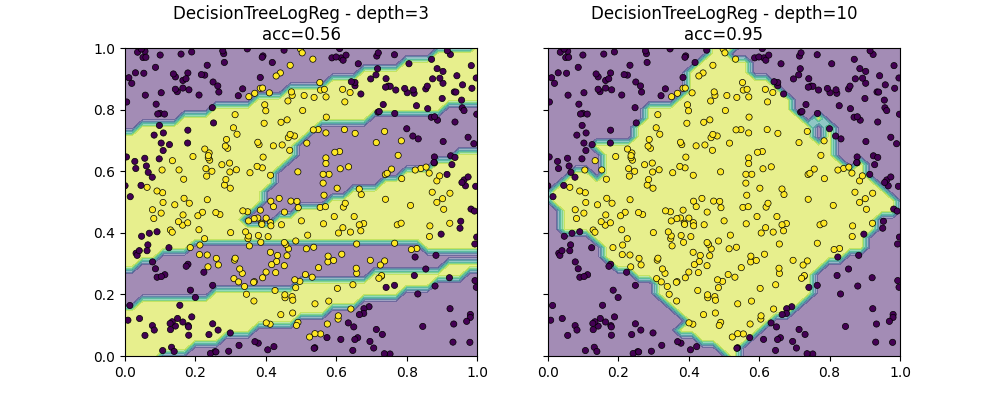
fig, ax = plt.subplots(1, 2, figsize=(10, 4), sharey=True)
plot_classifier_decision_zone(
dtlr,
X_test,
y_test,
ax=ax[0],
title="DecisionTreeLogReg - depth=%d\nacc=%1.2f"
% (dtlr.tree_depth_, dtlr.score(X_test, y_test)),
)
plot_classifier_decision_zone(
dtlr8,
X_test,
y_test,
ax=ax[1],
title="DecisionTreeLogReg - depth=%d\nacc=%1.2f"
% (dtlr8.tree_depth_, dtlr8.score(X_test, y_test)),
)
ax[0].set_xlim([0, 1])
ax[1].set_xlim([0, 1])
ax[0].set_ylim([0, 1])
[DTLR ]   trained acc 0.96 N=1500
[DTLRI]   change intercept 11.701424 --> 10.827550 in [0.198966, 16.652582]
[DTLR*]  above: n_class=2 N=1500 - 1090/1500
[DTLR ]    trained acc 0.99 N=1090
[DTLRI]    change intercept 5.898762 --> 1.318246 in [0.032974, 1.942469]
[DTLR*]   above: n_class=1 N=1090 - 679/1500
[DTLR*]   below: n_class=2 N=1090 - 411/1500
[DTLR ]     trained acc 0.98 N=411
[DTLRI]     change intercept 4.220764 --> 0.543776 in [0.321017, 0.688675]
[DTLR*]  below: n_class=2 N=1500 - 410/1500
[DTLR ]    trained acc 0.77 N=410
[DTLRI]    change intercept 5.534138 --> 6.534799 in [5.719886, 8.980899]
[DTLR*]   above: n_class=2 N=410 - 161/1500
[DTLR ]     trained acc 0.58 N=161
[DTLRI]     change intercept 1.451454 --> 1.107100 in [1.041815, 1.187738]
[DTLR*]   below: n_class=1 N=410 - 249/1500

(0.0, 1.0)
def draw_border(
    clr,
    X,
    y,
    fct=None,
    incx=0.1,
    incy=0.1,
    figsize=None,
    border=True,
    ax=None,
    s=10.0,
    linewidths=0.1,
):
    h = 0.02
    x_min, x_max = X[:, 0].min() - incx, X[:, 0].max() + incx
    y_min, y_max = X[:, 1].min() - incy, X[:, 1].max() + incy
    xx, yy = numpy.meshgrid(
        numpy.arange(x_min, x_max, h), numpy.arange(y_min, y_max, h)
    )
    if fct is None:
        Z = clr.predict(numpy.c_[xx.ravel(), yy.ravel()])
    else:
        Z = fct(clr, numpy.c_[xx.ravel(), yy.ravel()])

    # Put the result into a color plot
    cmap = plt.cm.tab20
    Z = Z.reshape(xx.shape)
    if ax is None:
        _fig, ax = plt.subplots(1, 1, figsize=figsize or (4, 3))
    ax.pcolormesh(xx, yy, Z, cmap=cmap)

    # Plot also the training points
    ax.scatter(
        X[:, 0], X[:, 1], c=y, edgecolors="k", cmap=cmap, s=s, linewidths=linewidths
    )

    ax.set_xlim(xx.min(), xx.max())
    ax.set_ylim(yy.min(), yy.max())
    return ax


fig, ax = plt.subplots(1, 2, figsize=(14, 4))
draw_border(dt, X_test, y_test, border=False, ax=ax[0])
ax[0].set_title("Iris")
draw_border(dt, X, y, border=False, ax=ax[1], fct=lambda m, x: predict_leaves(m, x))
ax[1].set_title("DecisionTree")
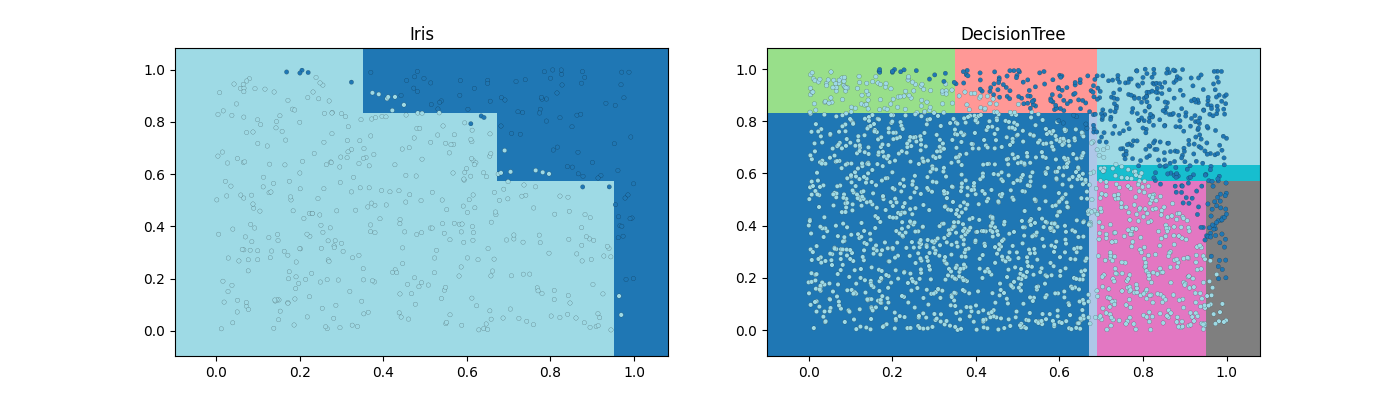
Text(0.5, 1.0, 'DecisionTree')
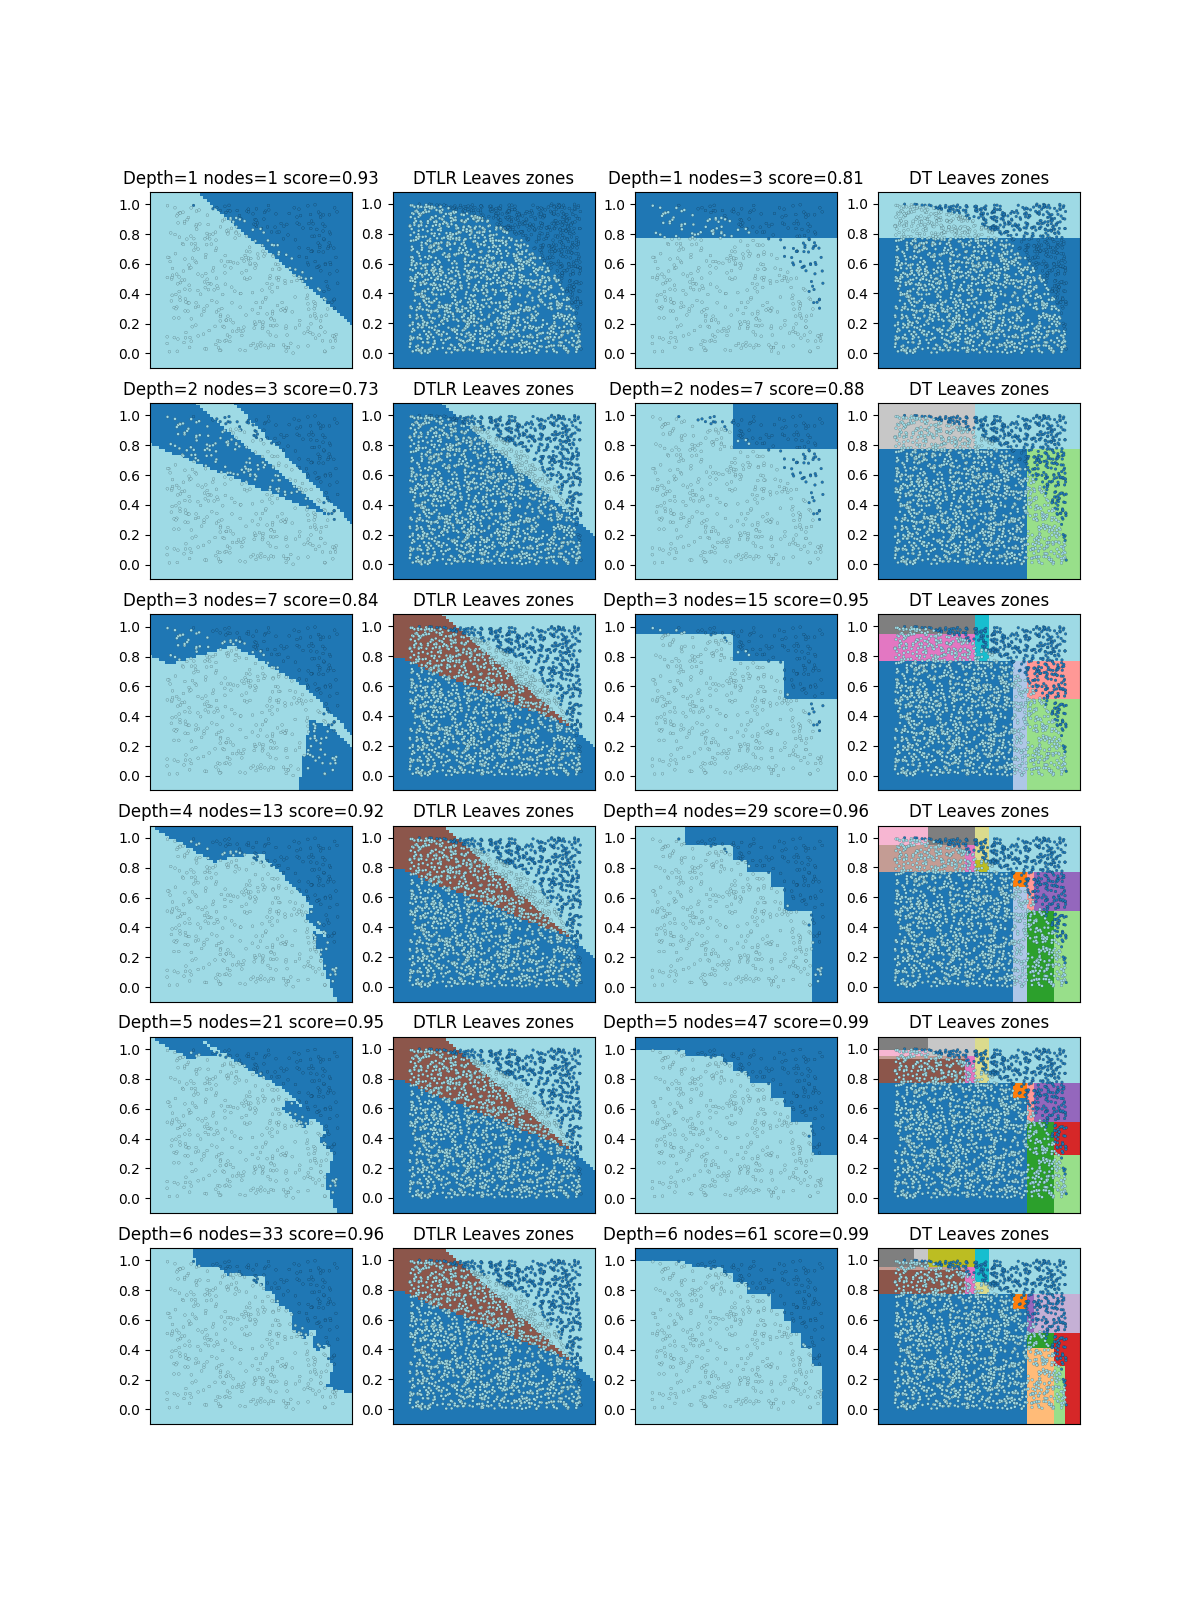
fig, ax = plt.subplots(6, 4, figsize=(12, 16))
for i, depth in tqdm(enumerate((1, 2, 3, 4, 5, 6))):
    dtl = DecisionTreeLogisticRegression(
        max_depth=depth, fit_improve_algo="intercept_sort_always", min_samples_leaf=2
    )
    dtl.fit(X_train, y_train)
    draw_border(dtl, X_test, y_test, border=False, ax=ax[i, 0], s=4.0)
    draw_border(
        dtl,
        X,
        y,
        border=False,
        ax=ax[i, 1],
        fct=lambda m, x: predict_leaves(m, x),
        s=4.0,
    )
    ax[i, 0].set_title(
        "Depth=%d nodes=%d score=%1.2f"
        % (dtl.tree_depth_, dtl.n_nodes_, dtl.score(X_test, y_test))
    )
    ax[i, 1].set_title("DTLR Leaves zones")

    dtl = DecisionTreeClassifier(max_depth=depth)
    dtl.fit(X_train, y_train)
    draw_border(dtl, X_test, y_test, border=False, ax=ax[i, 2], s=4.0)
    draw_border(
        dtl,
        X,
        y,
        border=False,
        ax=ax[i, 3],
        fct=lambda m, x: predict_leaves(m, x),
        s=4.0,
    )
    ax[i, 2].set_title(
        "Depth=%d nodes=%d score=%1.2f"
        % (dtl.max_depth, dtl.tree_.node_count, dtl.score(X_test, y_test))
    )
    ax[i, 3].set_title("DT Leaves zones")

    for k in range(ax.shape[1]):
        ax[i, k].get_xaxis().set_visible(False)
0it [00:00, ?it/s]
1it [00:00,  7.82it/s]
2it [00:00,  4.93it/s]
3it [00:00,  4.38it/s]
4it [00:00,  3.80it/s]
5it [00:01,  3.92it/s]
6it [00:01,  3.34it/s]
6it [00:01,  3.78it/s]
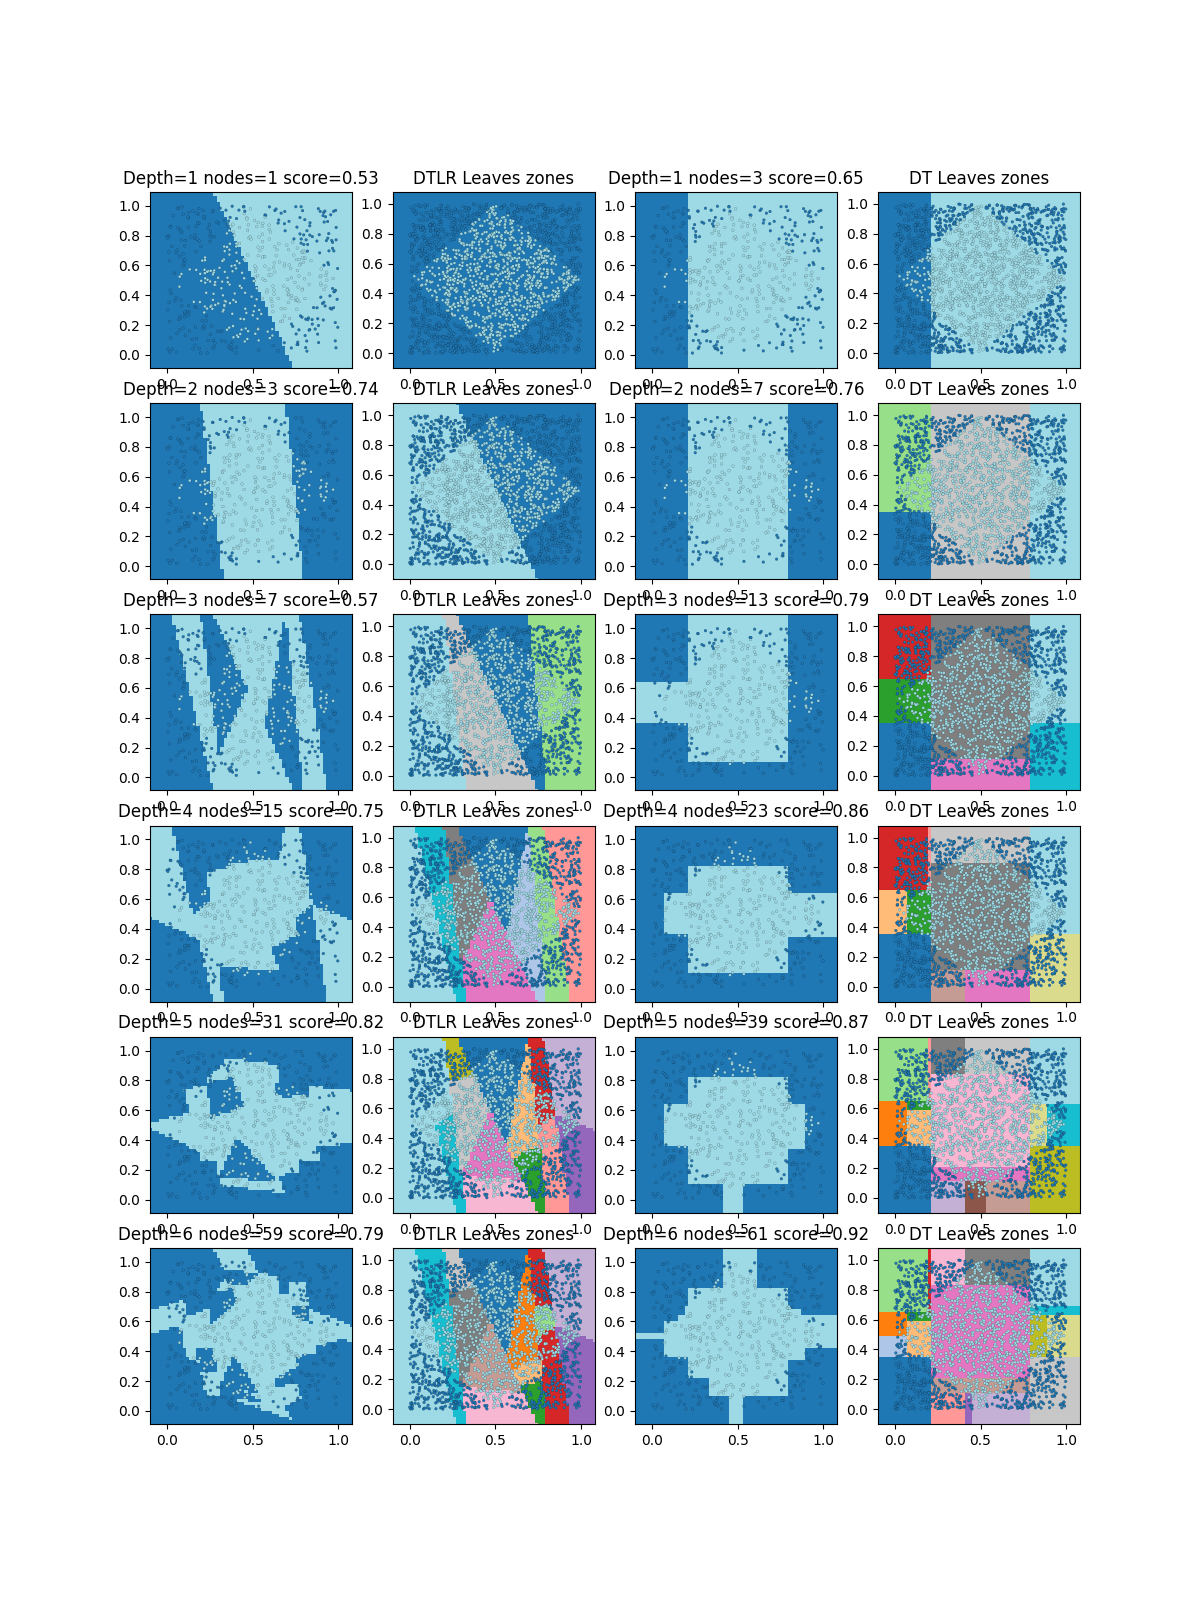
Another example designed to fail
Designed to be difficult with a regular decision tree.
def random_set(n):
    X = numpy.random.rand(n, 2)
    y = (
        (cdist(X, numpy.array([[0.5, 0.5]]), metric="minkowski", p=1) <= 0.5)
        .astype(numpy.int32)
        .ravel()
    )
    return X, y


X, y = random_set(2000)
X_train, X_test, y_train, y_test = train_test_split(X, y)
dt = DecisionTreeClassifier(max_depth=3)
dt.fit(X_train, y_train)
dt8 = DecisionTreeClassifier(max_depth=10)
dt8.fit(X_train, y_train)

fig, ax = plt.subplots(1, 2, figsize=(10, 4), sharey=True)
plot_classifier_decision_zone(
    dt,
    X_test,
    y_test,
    ax=ax[0],
    title="DecisionTree - max_depth=%d\nacc=%1.2f"
    % (dt.max_depth, dt.score(X_test, y_test)),
)
plot_classifier_decision_zone(
    dt8,
    X_test,
    y_test,
    ax=ax[1],
    title="DecisionTree - max_depth=%d\nacc=%1.2f"
    % (dt8.max_depth, dt8.score(X_test, y_test)),
)
ax[0].set_xlim([0, 1])
ax[1].set_xlim([0, 1])
ax[0].set_ylim([0, 1])
(0.0, 1.0)
The example is a square rotated by 45 degrees. Every sample in the square is a positive sample, every sample outside is a negative one. The tree approximates the border with horizontal and vertical lines.
dtlr = DecisionTreeLogisticRegression(
    max_depth=3, fit_improve_algo="intercept_sort_always", verbose=1
)
dtlr.fit(X_train, y_train)
dtlr8 = DecisionTreeLogisticRegression(
    max_depth=10, min_samples_split=4, fit_improve_algo="intercept_sort_always"
)
dtlr8.fit(X_train, y_train)

fig, ax = plt.subplots(1, 2, figsize=(10, 4), sharey=True)
plot_classifier_decision_zone(
    dtlr,
    X_test,
    y_test,
    ax=ax[0],
    title="DecisionTreeLogReg - depth=%d\nacc=%1.2f"
    % (dtlr.tree_depth_, dtlr.score(X_test, y_test)),
)
plot_classifier_decision_zone(
    dtlr8,
    X_test,
    y_test,
    ax=ax[1],
    title="DecisionTreeLogReg - depth=%d\nacc=%1.2f"
    % (dtlr8.tree_depth_, dtlr8.score(X_test, y_test)),
)
ax[0].set_xlim([0, 1])
ax[1].set_xlim([0, 1])
ax[0].set_ylim([0, 1])
[DTLR ]   trained acc 0.51 N=1500
[DTLRI]   change intercept 0.080361 --> 0.021443 in [-0.014513, 0.059398]
[DTLR*]  above: n_class=2 N=1500 - 749/1500
[DTLR ]    trained acc 0.73 N=749
[DTLRI]    change intercept -1.422680 --> -1.434831 in [-3.686067, 0.200131]
[DTLR*]   above: n_class=2 N=749 - 379/1500
[DTLR ]     trained acc 0.74 N=379
[DTLRI]     change intercept 0.005120 --> -0.984884 in [-1.694835, -0.615604]
[DTLR*]   below: n_class=2 N=749 - 370/1500
[DTLR ]     trained acc 0.72 N=370
[DTLRI]     change intercept -1.199615 --> -0.270695 in [-0.666456, 0.232422]
[DTLR*]  below: n_class=2 N=1500 - 751/1500
[DTLR ]    trained acc 0.74 N=751
[DTLRI]    change intercept 5.013738 --> 4.966341 in [2.432195, 6.687198]
[DTLR*]   above: n_class=2 N=751 - 378/1500
[DTLR ]     trained acc 0.76 N=378
[DTLRI]     change intercept 3.050522 --> 1.927897 in [1.132882, 2.306134]
[DTLR*]   below: n_class=2 N=751 - 373/1500
[DTLR ]     trained acc 0.73 N=373
[DTLRI]     change intercept 1.372089 --> 2.350789 in [1.969512, 2.804065]

(0.0, 1.0)
Leave zones
# We use method *decision_path* to understand which leaf is responsible
# for which zone.


fig, ax = plt.subplots(1, 2, figsize=(14, 4))
draw_border(dtlr, X_test, y_test, border=False, ax=ax[0])
ax[0].set_title("Iris")
draw_border(dtlr, X, y, border=False, ax=ax[1], fct=lambda m, x: predict_leaves(m, x))
ax[1].set_title("DecisionTreeLogisticRegression")
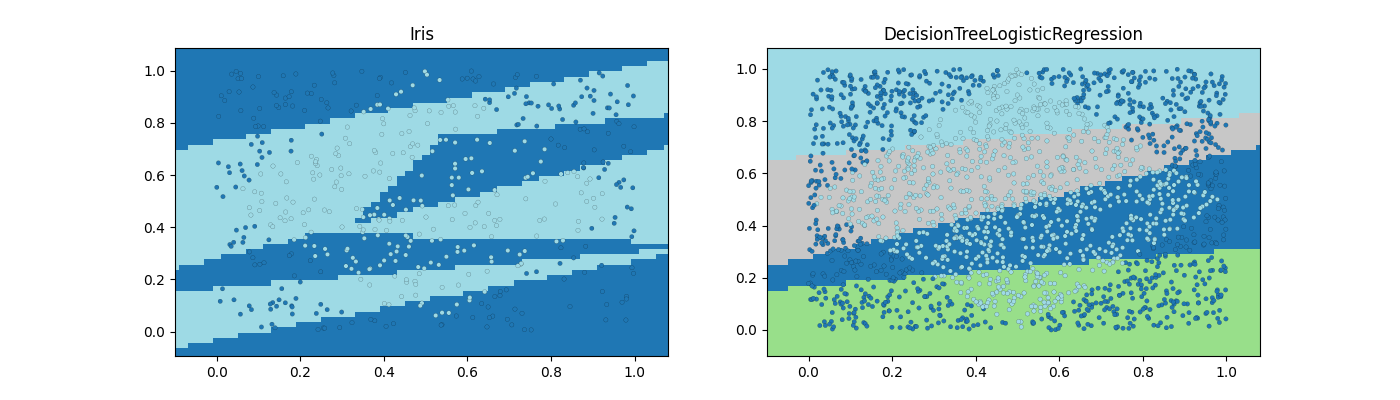
Text(0.5, 1.0, 'DecisionTreeLogisticRegression')
fig, ax = plt.subplots(6, 4, figsize=(12, 16))
for i, depth in tqdm(enumerate((1, 2, 3, 4, 5, 6))):
    dtl = DecisionTreeLogisticRegression(
        max_depth=depth, fit_improve_algo="intercept_sort_always", min_samples_leaf=2
    )
    dtl.fit(X_train, y_train)
    draw_border(dtl, X_test, y_test, border=False, ax=ax[i, 0], s=4.0)
    draw_border(
        dtl,
        X,
        y,
        border=False,
        ax=ax[i, 1],
        fct=lambda m, x: predict_leaves(m, x),
        s=4.0,
    )
    ax[i, 0].set_title(
        "Depth=%d nodes=%d score=%1.2f"
        % (dtl.tree_depth_, dtl.n_nodes_, dtl.score(X_test, y_test))
    )
    ax[i, 1].set_title("DTLR Leaves zones")

    dtl = DecisionTreeClassifier(max_depth=depth)
    dtl.fit(X_train, y_train)
    draw_border(dtl, X_test, y_test, border=False, ax=ax[i, 2], s=4.0)
    draw_border(
        dtl,
        X,
        y,
        border=False,
        ax=ax[i, 3],
        fct=lambda m, x: predict_leaves(m, x),
        s=4.0,
    )
    ax[i, 2].set_title(
        "Depth=%d nodes=%d score=%1.2f"
        % (dtl.max_depth, dtl.tree_.node_count, dtl.score(X_test, y_test))
    )
    ax[i, 3].set_title("DT Leaves zones")
0it [00:00, ?it/s]
2it [00:00,  9.23it/s]
3it [00:00,  6.03it/s]
4it [00:00,  4.05it/s]
5it [00:01,  3.64it/s]
6it [00:01,  3.00it/s]
6it [00:01,  3.70it/s]
Total running time of the script: (0 minutes 7.240 seconds)