Note
Go to the end to download the full example code.
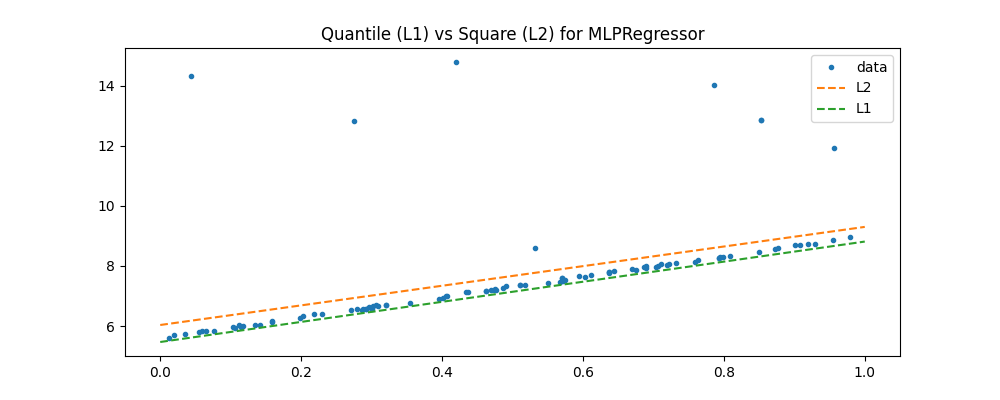
Quantile MLPRegressor
scikit-learn does not have a
quantile regression for multi-layer perceptron.
mlinsights
implements a version of it based on the scikit-learn model. The
implementation overwrites method _backprop.
We first generate some dummy data.
import numpy
from pandas import DataFrame
import matplotlib.pyplot as plt
from sklearn.neural_network import MLPRegressor
from mlinsights.mlmodel import QuantileMLPRegressor


X = numpy.random.random(1000)
eps1 = (numpy.random.random(900) - 0.5) * 0.1
eps2 = (numpy.random.random(100)) * 10
eps = numpy.hstack([eps1, eps2])
X = X.reshape((1000, 1))
Y = X.ravel() * 3.4 + 5.6 + eps
clr = MLPRegressor(hidden_layer_sizes=(30,), activation="tanh")
clr.fit(X, Y)
~/vv/this312/lib/python3.12/site-packages/sklearn/neural_network/_multilayer_perceptron.py:781: ConvergenceWarning: Stochastic Optimizer: Maximum iterations (200) reached and the optimization hasn't converged yet.
  warnings.warn(
clq = QuantileMLPRegressor(hidden_layer_sizes=(30,), activation="tanh")
clq.fit(X, Y)
fig, ax = plt.subplots(1, 1, figsize=(10, 4))
choice = numpy.random.choice(X.shape[0] - 1, size=100)
xx = X.ravel()[choice]
yy = Y[choice]
ax.plot(xx, yy, ".", label="data")
xx = numpy.array([[0], [1]])
y1 = clr.predict(xx)
y2 = clq.predict(xx)
ax.plot(xx, y1, "--", label="L2")
ax.plot(xx, y2, "--", label="L1")
ax.set_title("Quantile (L1) vs Square (L2) for MLPRegressor")
ax.legend()
<matplotlib.legend.Legend object at 0x79fb9ec0c8c0>
Total running time of the script: (0 minutes 3.772 seconds)