mlinsights.plotting
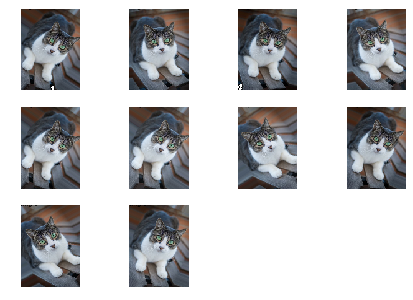
- mlinsights.plotting.gallery.plot_gallery_images(imgs, texts=None, width=4, return_figure=False, ax=None, folder_image=None, **figure)[source]
Plots a gallery of images using matplotlib.
- Parameters:
imgs – list of images (filename, urls or Pillow objects),
texts – text to display (if None, print
'img % i')width – number of images on the same line (unused if imgs is a matrix)
figure – additional parameters when the figure is created
return_figure – return the figure as well as the axes
ax – None or existing axes, it should have the sam shape of imgs
folder_image – image paths may be relative to some folder, in that case, they should be relative to this folder
- Returns:
axes or (figure, axes) if return_figure is True

- mlinsights.plotting.visualize.pipeline2dot(pipe, data, **params)[source]
Exports a scikit-learn pipeline to DOT language. See Visualize a scikit-learn pipeline for an example.
- Parameters:
pipe – scikit-learn pipeline
data – training data as a dataframe or a numpy array, or just a list with the variable names
params – additional params to draw the graph
- Returns:
string
Default options for the graph are:
options = {
    'orientation': 'portrait',
    'ranksep': '0.25',
    'nodesep': '0.05',
    'width': '0.5',
    'height': '0.1',
}
- mlinsights.plotting.visualize.pipeline2str(pipe, indent=3)[source]
Exports a scikit-learn pipeline to text.
- Parameters:
pipe – scikit-learn pipeline
indent – indent
- Returns:
str
<<<
from sklearn.linear_model import LogisticRegression
from sklearn.impute import SimpleImputer
from sklearn.preprocessing import OneHotEncoder
from sklearn.preprocessing import StandardScaler, MinMaxScaler
from sklearn.compose import ColumnTransformer
from sklearn.pipeline import Pipeline

from mlinsights.plotting import pipeline2str

numeric_features = ["age", "fare"]
numeric_transformer = Pipeline(
    steps=[("imputer", SimpleImputer(strategy="median")), ("scaler", StandardScaler())]
)

categorical_features = ["embarked", "sex", "pclass"]
categorical_transformer = Pipeline(
    steps=[
        ("imputer", SimpleImputer(strategy="constant", fill_value="missing")),
        ("onehot", OneHotEncoder(handle_unknown="ignore")),
    ]
)

preprocessor = ColumnTransformer(
    transformers=[
        ("num", numeric_transformer, numeric_features),
        ("cat", categorical_transformer, categorical_features),
    ]
)

clf = Pipeline(
    steps=[
        ("preprocessor", preprocessor),
        ("classifier", LogisticRegression(solver="lbfgs")),
    ]
)
text = pipeline2str(clf)
print(text)
>>>
    Pipeline
       ColumnTransformer
          Pipeline(age,fare)
             SimpleImputer
             StandardScaler
          Pipeline(embarked,sex,pclass)
             SimpleImputer
             OneHotEncoder
       LogisticRegression