Note
Go to the end to download the full example code.
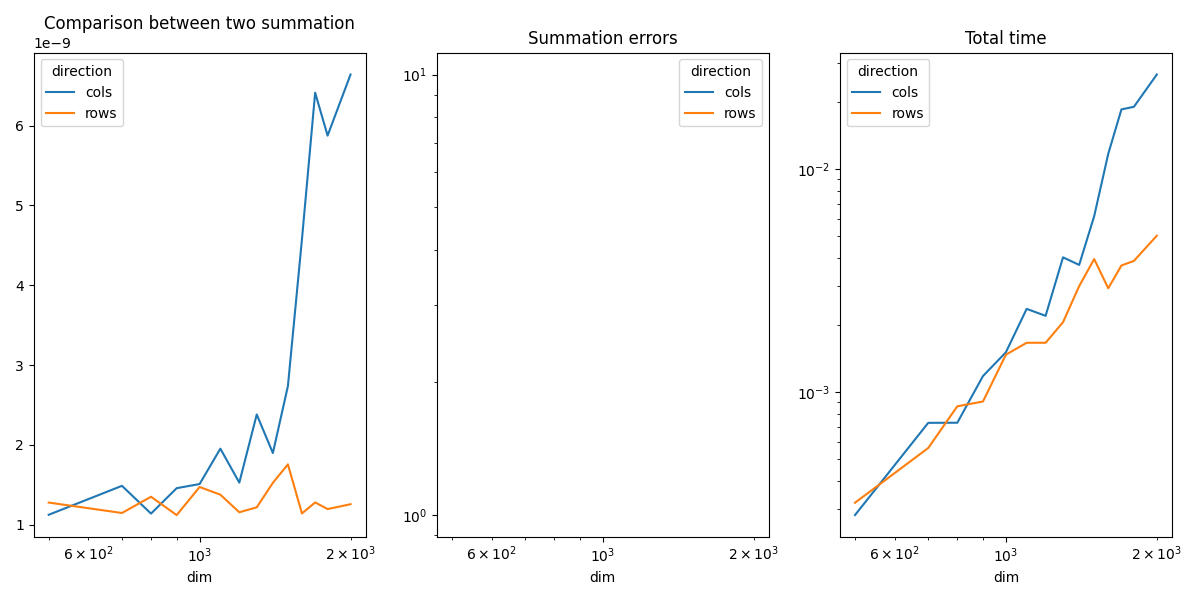
Measuring CPU performance with a vector sum
The example compares the time spend in computing the sum of all coefficients of a matrix when the function walks through the coefficients by rows or by columns.
Vector Sum
from tqdm import tqdm
import numpy
import matplotlib.pyplot as plt
from pandas import DataFrame
from teachcompute.ext_test_case import measure_time, unit_test_going
from teachcompute.validation.cpu._validation import vector_sum_array as vector_sum

obs = []
dims = [500, 700, 800, 900, 1000, 1100, 1200, 1300, 1400, 1500, 1600, 1700, 1800, 2000]
if unit_test_going():
    dims = [10, 20, 30]
for dim in tqdm(dims):
    values = numpy.ones((dim, dim), dtype=numpy.float32).ravel()
    diff = abs(vector_sum(dim, values, True) - dim**2)

    res = measure_time(
        lambda dim=dim, values=values: vector_sum(dim, values, True), max_time=0.5
    )

    obs.append(
        dict(
            dim=dim,
            size=values.size,
            time=res["average"],
            direction="rows",
            time_per_element=res["average"] / dim**2,
            diff=diff,
        )
    )

    diff = abs(vector_sum(dim, values, False) - dim**2)
    res = measure_time(
        lambda dim=dim, values=values: vector_sum(dim, values, False), max_time=0.5
    )

    obs.append(
        dict(
            dim=dim,
            size=values.size,
            time=res["average"],
            direction="cols",
            time_per_element=res["average"] / dim**2,
            diff=diff,
        )
    )


df = DataFrame(obs)
piv = df.pivot(index="dim", columns="direction", values="time_per_element")
print(piv)
  0%|          | 0/14 [00:00<?, ?it/s]
  7%|▋         | 1/14 [00:01<00:16,  1.27s/it]
 14%|█▍        | 2/14 [00:02<00:14,  1.21s/it]
 21%|██▏       | 3/14 [00:03<00:12,  1.15s/it]
 29%|██▊       | 4/14 [00:04<00:11,  1.12s/it]
 36%|███▌      | 5/14 [00:05<00:09,  1.09s/it]
 43%|████▎     | 6/14 [00:06<00:09,  1.14s/it]
 50%|█████     | 7/14 [00:07<00:07,  1.12s/it]
 57%|█████▋    | 8/14 [00:09<00:06,  1.15s/it]
 64%|██████▍   | 9/14 [00:10<00:05,  1.17s/it]
 71%|███████▏  | 10/14 [00:11<00:04,  1.16s/it]
 79%|███████▊  | 11/14 [00:12<00:03,  1.12s/it]
 86%|████████▌ | 12/14 [00:13<00:02,  1.15s/it]
 93%|█████████▎| 13/14 [00:14<00:01,  1.15s/it]
100%|██████████| 14/14 [00:16<00:00,  1.17s/it]
100%|██████████| 14/14 [00:16<00:00,  1.15s/it]
direction          cols          rows
dim
500        9.091406e-10  8.934855e-10
700        9.039265e-10  8.570284e-10
800        1.096104e-09  8.634412e-10
900        9.587425e-10  8.674596e-10
1000       9.952240e-10  8.431674e-10
1100       9.901781e-10  8.620436e-10
1200       1.067252e-09  9.156894e-10
1300       1.066420e-09  8.789750e-10
1400       1.114935e-09  8.902120e-10
1500       1.345426e-09  8.912007e-10
1600       1.804858e-09  8.801013e-10
1700       1.585282e-09  9.119636e-10
1800       1.758240e-09  8.879621e-10
2000       3.904051e-09  8.841717e-10
Plots
piv_diff = df.pivot(index="dim", columns="direction", values="diff")
piv_time = df.pivot(index="dim", columns="direction", values="time")

fig, ax = plt.subplots(1, 3, figsize=(12, 6))
piv.plot(ax=ax[0], logx=True, title="Comparison between two summation")
piv_diff.plot(ax=ax[1], logx=True, logy=True, title="Summation errors")
piv_time.plot(ax=ax[2], logx=True, logy=True, title="Total time")
fig.tight_layout()
fig.savefig("plot_bench_cpu_vector_sum.png")
~/vv/this312/lib/python3.12/site-packages/pandas/plotting/_matplotlib/core.py:822: UserWarning: Data has no positive values, and therefore cannot be log-scaled.
  labels = axis.get_majorticklabels() + axis.get_minorticklabels()
The summation by rows is much faster as expected. That explains why it is usually more efficient to transpose the first matrix before a matrix multiplication.
Total running time of the script: (0 minutes 17.273 seconds)