Note
Go to the end to download the full example code.
Measuring CUDA performance with a vector addition with streams
Measure the time between two additions, with or without streams. The script can be profiled with Nsight.
nsys profile python _doc/examples/plot_bench_cuda_vector_add_stream.py
Vector Add
from tqdm import tqdm
import numpy
import matplotlib.pyplot as plt
from pandas import DataFrame
from teachcompute.ext_test_case import measure_time, unit_test_going
import torch

has_cuda = torch.cuda.is_available()

try:
    from teachcompute.validation.cuda.cuda_example_py import (
        vector_add,
        vector_add_stream,
    )
except ImportError:
    has_cuda = False


def cuda_vector_add(values):
    torch.cuda.nvtx.range_push(f"CUDA dim={values.size}")
    res = vector_add(values, values, 0, repeat=10)
    torch.cuda.nvtx.range_pop()
    return res


def cuda_vector_add_stream(values):
    torch.cuda.nvtx.range_push(f"CUDA stream dim={values.size}")
    res = vector_add_stream(values, values, 0, repeat=10)
    torch.cuda.nvtx.range_pop()
    return res


obs = []
dims = [2**10, 2**15, 2**20]
if unit_test_going():
    dims = [10, 20, 30]
for dim in tqdm(dims):
    values = numpy.ones((dim,), dtype=numpy.float32).ravel()

    if has_cuda:
        diff = numpy.abs(vector_add(values, values, 0) - (values + values)).max()
        res = measure_time(lambda values=values: cuda_vector_add(values), max_time=0.5)

        obs.append(
            dict(
                dim=dim,
                size=values.size,
                time=res["average"],
                fct="CUDA",
                time_per_element=res["average"] / dim,
                diff=diff,
            )
        )

        diff = numpy.abs(vector_add_stream(values, values, 0) - (values + values)).max()
        res = measure_time(
            lambda values=values: cuda_vector_add_stream(values), max_time=0.5
        )

        obs.append(
            dict(
                dim=dim,
                size=values.size,
                time=res["average"],
                fct="CUDA-stream",
                time_per_element=res["average"] / dim,
                diff=diff,
            )
        )


if has_cuda:
    df = DataFrame(obs)
    piv = df.pivot(index="dim", columns="fct", values="time_per_element")
    print(piv)
  0%|          | 0/3 [00:00<?, ?it/s]
 33%|███▎      | 1/3 [00:01<00:02,  1.27s/it]
 67%|██████▋   | 2/3 [00:02<00:01,  1.33s/it]
100%|██████████| 3/3 [00:03<00:00,  1.32s/it]
100%|██████████| 3/3 [00:03<00:00,  1.32s/it]
fct              CUDA   CUDA-stream
dim
1024     4.850350e-06  5.337401e-06
32768    1.234465e-07  1.848561e-07
1048576  1.771046e-08  1.865589e-08
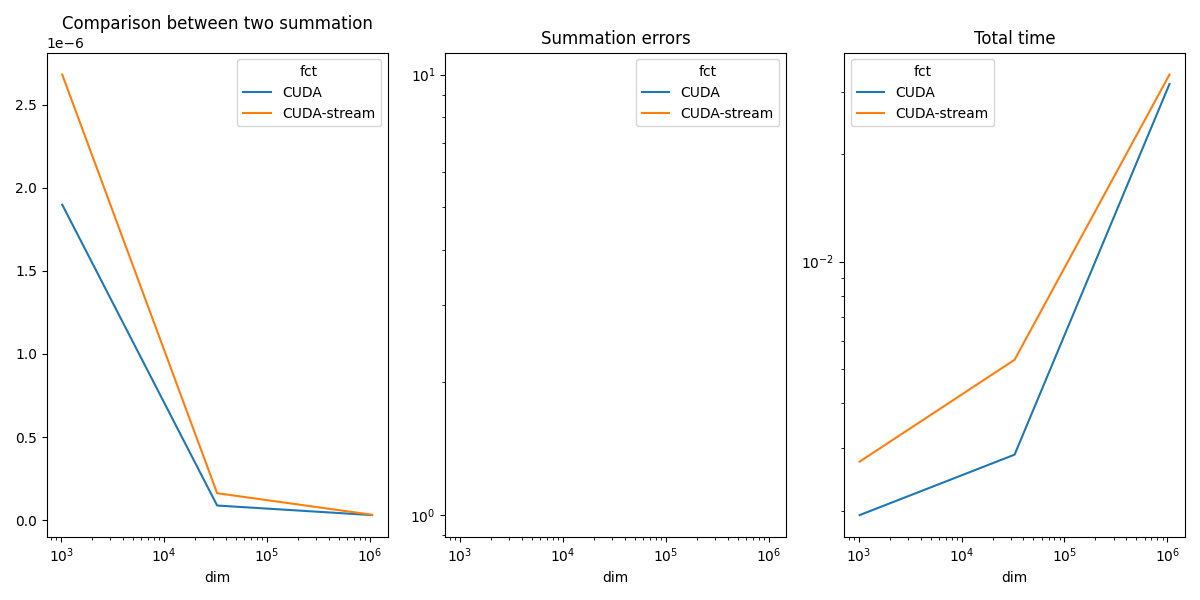
Plots
if has_cuda:
    piv_diff = df.pivot(index="dim", columns="fct", values="diff")
    piv_time = df.pivot(index="dim", columns="fct", values="time")

    fig, ax = plt.subplots(1, 3, figsize=(12, 6))
    piv.plot(ax=ax[0], logx=True, title="Comparison between two summation")
    piv_diff.plot(ax=ax[1], logx=True, logy=True, title="Summation errors")
    piv_time.plot(ax=ax[2], logx=True, logy=True, title="Total time")
    fig.tight_layout()
    fig.savefig("plot_bench_cuda_vector_add_stream.png")
~/vv/this312/lib/python3.12/site-packages/pandas/plotting/_matplotlib/core.py:822: UserWarning: Data has no positive values, and therefore cannot be log-scaled.
  labels = axis.get_majorticklabels() + axis.get_minorticklabels()
In practice, one stream is usually enough. CUDA parallelizes everything and takes all the computing power.
Total running time of the script: (0 minutes 5.009 seconds)