Note
Go to the end to download the full example code.
Compares dot implementations (numpy, cython, c++, sse)
numpy has a very fast implementation of the dot product. It is difficult to be better and very easy to be slower. This example looks into a couple of slower implementations with cython. The tested functions are the following:
import numpy
import matplotlib.pyplot as plt
from pandas import DataFrame, concat
from teachcompute.validation.cython.dot_cython import (
    dot_product,
    ddot_cython_array,
    ddot_cython_array_optim,
    ddot_array,
    ddot_array_16,
    ddot_array_16_sse,
)
from teachcompute.validation.cython.dot_cython import (
    sdot_cython_array,
    sdot_cython_array_optim,
    sdot_array,
    sdot_array_16,
    sdot_array_16_sse,
)
from teachcompute.ext_test_case import measure_time_dim


def get_vectors(fct, n, h=100, dtype=numpy.float64):
    ctxs = [
        dict(
            va=numpy.random.randn(n).astype(dtype),
            vb=numpy.random.randn(n).astype(dtype),
            dot=fct,
            x_name=n,
        )
        for n in range(10, n, h)
    ]
    return ctxs
numpy dot
  0%|          | 0/100 [00:00<?, ?it/s]
 89%|████████▉ | 89/100 [00:00<00:00, 881.93it/s]
100%|██████████| 100/100 [00:00<00:00, 835.84it/s]
     average     deviation  min_exec  max_exec  repeat  number     ttime  context_size  warmup_time  x_name        fct
97  0.000002  1.871898e-07  0.000002  0.000003      10      50  0.000023           184     0.000019    9710  numpy.dot
98  0.000002  2.991062e-07  0.000002  0.000003      10      50  0.000024           184     0.000015    9810  numpy.dot
99  0.000003  4.488202e-07  0.000003  0.000004      10      50  0.000032           184     0.000031    9910  numpy.dot
Several cython dot
for fct in [
    dot_product,
    ddot_cython_array,
    ddot_cython_array_optim,
    ddot_array,
    ddot_array_16,
    ddot_array_16_sse,
]:
    ctxs = get_vectors(fct, 10000 if fct.__name__ != "dot_product" else 1000)

    df = DataFrame(list(measure_time_dim("dot(va, vb)", ctxs, verbose=1)))
    df["fct"] = fct.__name__
    dfs.append(df)
    print(df.tail(n=3))
  0%|          | 0/10 [00:00<?, ?it/s]
 50%|█████     | 5/10 [00:00<00:00, 38.63it/s]
 90%|█████████ | 9/10 [00:00<00:00, 17.98it/s]
100%|██████████| 10/10 [00:00<00:00, 17.65it/s]
    average  deviation  min_exec  max_exec  repeat  number     ttime  context_size  warmup_time  x_name          fct
7  0.000162   0.000014  0.000149  0.000201      10      50  0.001623           184     0.000232     710  dot_product
8  0.000207   0.000037  0.000175  0.000295      10      50  0.002072           184     0.000172     810  dot_product
9  0.000218   0.000021  0.000190  0.000257      10      50  0.002182           184     0.000326     910  dot_product

  0%|          | 0/100 [00:00<?, ?it/s]
 53%|█████▎    | 53/100 [00:00<00:00, 520.87it/s]
100%|██████████| 100/100 [00:00<00:00, 337.57it/s]
     average     deviation  min_exec  max_exec  repeat  number     ttime  context_size  warmup_time  x_name                fct
97  0.000009  4.723389e-07  0.000008  0.000010      10      50  0.000086           184     0.000019    9710  ddot_cython_array
98  0.000010  1.277981e-06  0.000009  0.000013      10      50  0.000101           184     0.000022    9810  ddot_cython_array
99  0.000009  3.489316e-07  0.000009  0.000010      10      50  0.000090           184     0.000017    9910  ddot_cython_array

  0%|          | 0/100 [00:00<?, ?it/s]
 56%|█████▌    | 56/100 [00:00<00:00, 548.27it/s]
100%|██████████| 100/100 [00:00<00:00, 350.64it/s]
     average     deviation  min_exec  max_exec  repeat  number     ttime  context_size  warmup_time  x_name                      fct
97  0.000008  1.894224e-07  0.000008  0.000009      10      50  0.000085           184     0.000019    9710  ddot_cython_array_optim
98  0.000009  6.923417e-07  0.000008  0.000010      10      50  0.000090           184     0.000018    9810  ddot_cython_array_optim
99  0.000013  6.845579e-06  0.000009  0.000032      10      50  0.000126           184     0.000025    9910  ddot_cython_array_optim

  0%|          | 0/100 [00:00<?, ?it/s]
 53%|█████▎    | 53/100 [00:00<00:00, 528.41it/s]
100%|██████████| 100/100 [00:00<00:00, 339.47it/s]
     average     deviation  min_exec  max_exec  repeat  number     ttime  context_size  warmup_time  x_name         fct
97  0.000009  3.760900e-07  0.000008  0.000009      10      50  0.000086           184     0.000018    9710  ddot_array
98  0.000010  1.525365e-06  0.000008  0.000014      10      50  0.000100           184     0.000016    9810  ddot_array
99  0.000011  1.800946e-06  0.000009  0.000014      10      50  0.000113           184     0.000019    9910  ddot_array

  0%|          | 0/100 [00:00<?, ?it/s]
 70%|███████   | 70/100 [00:00<00:00, 689.20it/s]
100%|██████████| 100/100 [00:00<00:00, 548.42it/s]
     average     deviation  min_exec  max_exec  repeat  number     ttime  context_size  warmup_time  x_name            fct
97  0.000006  3.583172e-07  0.000006  0.000007      10      50  0.000064           184     0.000013    9710  ddot_array_16
98  0.000006  8.240328e-07  0.000005  0.000007      10      50  0.000062           184     0.000011    9810  ddot_array_16
99  0.000009  4.985125e-06  0.000005  0.000019      10      50  0.000088           184     0.000020    9910  ddot_array_16

  0%|          | 0/100 [00:00<?, ?it/s]
 71%|███████   | 71/100 [00:00<00:00, 704.87it/s]
100%|██████████| 100/100 [00:00<00:00, 584.37it/s]
     average     deviation  min_exec  max_exec  repeat  number     ttime  context_size  warmup_time  x_name                fct
97  0.000005  2.971827e-07  0.000004  0.000005      10      50  0.000046           184     0.000016    9710  ddot_array_16_sse
98  0.000005  2.146043e-07  0.000004  0.000005      10      50  0.000046           184     0.000016    9810  ddot_array_16_sse
99  0.000004  5.776808e-07  0.000003  0.000005      10      50  0.000043           184     0.000015    9910  ddot_array_16_sse
Let’s display the results
cc = concat(dfs)
cc["N"] = cc["x_name"]

fig, ax = plt.subplots(2, 2, figsize=(10, 10))
cc[cc.N <= 1100].pivot(index="N", columns="fct", values="average").plot(
    logy=True, logx=True, ax=ax[0, 0]
)
cc[cc.fct != "dot_product"].pivot(index="N", columns="fct", values="average").plot(
    logy=True, ax=ax[0, 1]
)
cc[cc.fct != "dot_product"].pivot(index="N", columns="fct", values="average").plot(
    logy=True, logx=True, ax=ax[1, 1]
)
ax[0, 0].set_title("Comparison of cython ddot implementations")
ax[0, 1].set_title("Comparison of cython ddot implementations\nwithout dot_product")

###################
# :epkg:`numpy` is faster but we are able to catch up.
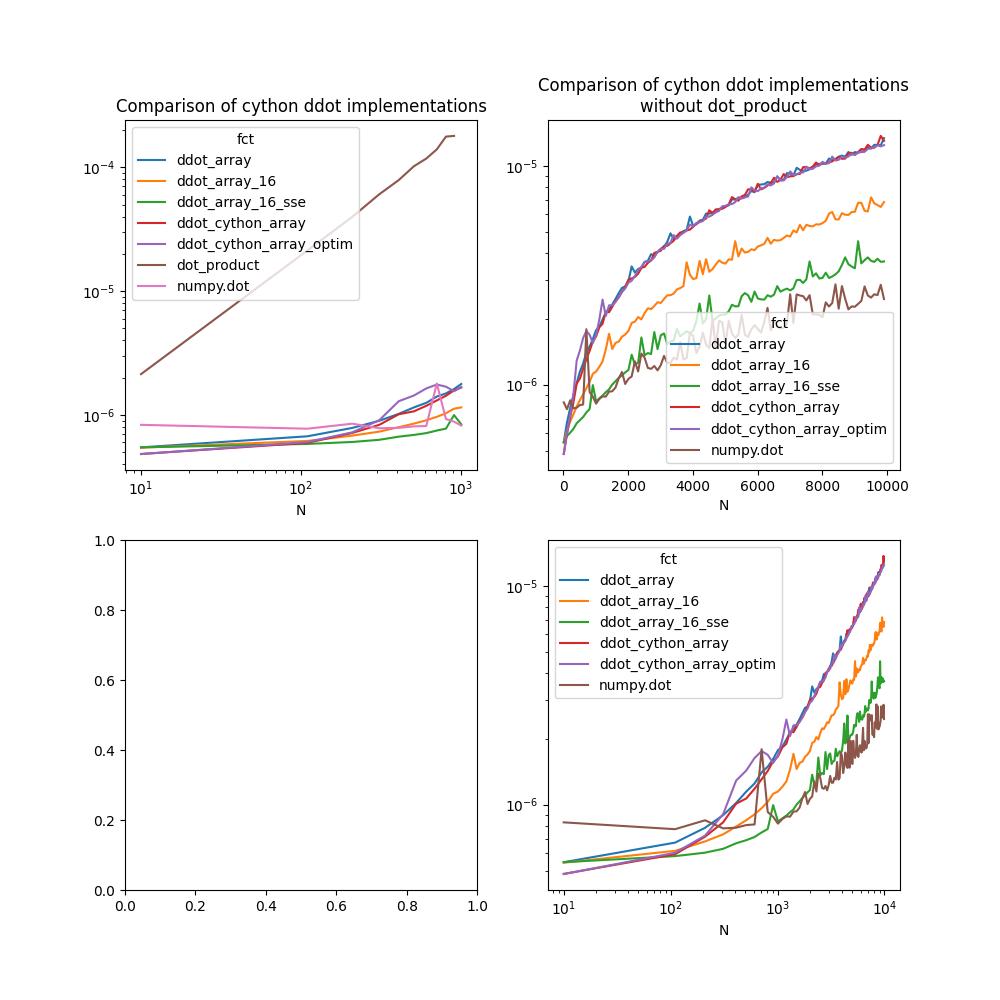
Text(0.5, 1.0, 'Comparison of cython ddot implementations\nwithout dot_product')
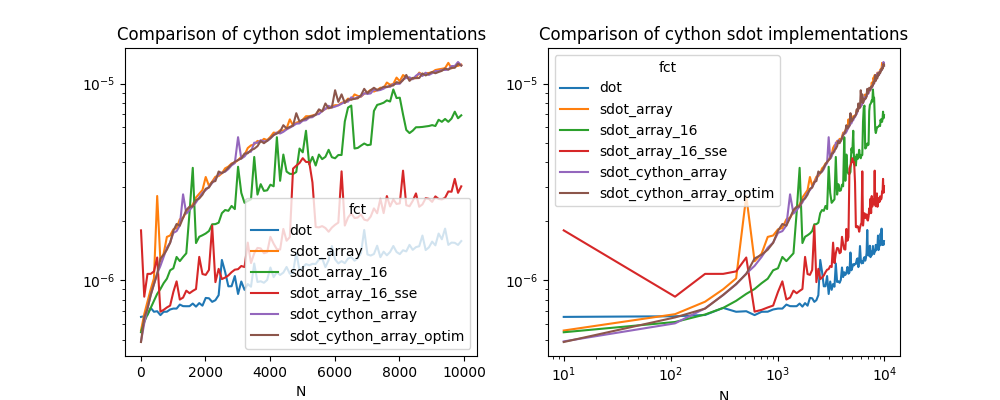
Same for floats
Let’s for single floats.
dfs = []
for fct in [
    numpy.dot,
    sdot_cython_array,
    sdot_cython_array_optim,
    sdot_array,
    sdot_array_16,
    sdot_array_16_sse,
]:
    ctxs = get_vectors(
        fct, 10000 if fct.__name__ != "dot_product" else 1000, dtype=numpy.float32
    )

    df = DataFrame(list(measure_time_dim("dot(va, vb)", ctxs, verbose=1)))
    df["fct"] = fct.__name__
    dfs.append(df)
    print(df.tail(n=3))


cc = concat(dfs)
cc["N"] = cc["x_name"]

fig, ax = plt.subplots(1, 2, figsize=(10, 4))
cc.pivot(index="N", columns="fct", values="average").plot(logy=True, ax=ax[0])
cc.pivot(index="N", columns="fct", values="average").plot(
    logy=True, logx=True, ax=ax[1]
)
ax[0].set_title("Comparison of cython sdot implementations")
ax[1].set_title("Comparison of cython sdot implementations")
  0%|          | 0/100 [00:00<?, ?it/s]
 92%|█████████▏| 92/100 [00:00<00:00, 907.44it/s]
100%|██████████| 100/100 [00:00<00:00, 874.26it/s]
     average     deviation  min_exec  max_exec  repeat  number     ttime  context_size  warmup_time  x_name  fct
97  0.000003  2.806175e-07  0.000002  0.000003      10      50  0.000025           184     0.000014    9710  dot
98  0.000002  3.972760e-07  0.000002  0.000003      10      50  0.000022           184     0.000016    9810  dot
99  0.000002  3.392017e-07  0.000001  0.000003      10      50  0.000016           184     0.000014    9910  dot

  0%|          | 0/100 [00:00<?, ?it/s]
 60%|██████    | 60/100 [00:00<00:00, 588.58it/s]
100%|██████████| 100/100 [00:00<00:00, 383.67it/s]
     average     deviation  min_exec  max_exec  repeat  number     ttime  context_size  warmup_time  x_name                fct
97  0.000008  3.480628e-07  0.000008  0.000009      10      50  0.000084           184     0.000011    9710  sdot_cython_array
98  0.000009  3.360627e-07  0.000008  0.000009      10      50  0.000087           184     0.000010    9810  sdot_cython_array
99  0.000010  1.416325e-06  0.000009  0.000013      10      50  0.000103           184     0.000016    9910  sdot_cython_array

  0%|          | 0/100 [00:00<?, ?it/s]
 58%|█████▊    | 58/100 [00:00<00:00, 575.65it/s]
100%|██████████| 100/100 [00:00<00:00, 388.40it/s]
     average     deviation  min_exec  max_exec  repeat  number     ttime  context_size  warmup_time  x_name                      fct
97  0.000008  2.345668e-07  0.000008  0.000009      10      50  0.000084           184     0.000012    9710  sdot_cython_array_optim
98  0.000008  1.764625e-07  0.000008  0.000009      10      50  0.000084           184     0.000012    9810  sdot_cython_array_optim
99  0.000009  9.233967e-07  0.000009  0.000012      10      50  0.000093           184     0.000011    9910  sdot_cython_array_optim

  0%|          | 0/100 [00:00<?, ?it/s]
 54%|█████▍    | 54/100 [00:00<00:00, 535.97it/s]
100%|██████████| 100/100 [00:00<00:00, 350.34it/s]
     average     deviation  min_exec  max_exec  repeat  number     ttime  context_size  warmup_time  x_name         fct
97  0.000009  4.261034e-07  0.000008  0.000009      10      50  0.000087           184     0.000014    9710  sdot_array
98  0.000009  8.125298e-07  0.000008  0.000011      10      50  0.000093           184     0.000023    9810  sdot_array
99  0.000009  5.007583e-07  0.000008  0.000010      10      50  0.000088           184     0.000012    9910  sdot_array

  0%|          | 0/100 [00:00<?, ?it/s]
 69%|██████▉   | 69/100 [00:00<00:00, 681.09it/s]
100%|██████████| 100/100 [00:00<00:00, 578.73it/s]
     average     deviation  min_exec  max_exec  repeat  number     ttime  context_size  warmup_time  x_name            fct
97  0.000004  6.268399e-07  0.000004  0.000006      10      50  0.000044           184     0.000010    9710  sdot_array_16
98  0.000004  3.525898e-07  0.000004  0.000005      10      50  0.000041           184     0.000009    9810  sdot_array_16
99  0.000004  4.301602e-07  0.000004  0.000005      10      50  0.000043           184     0.000008    9910  sdot_array_16

  0%|          | 0/100 [00:00<?, ?it/s]
 86%|████████▌ | 86/100 [00:00<00:00, 857.42it/s]
100%|██████████| 100/100 [00:00<00:00, 767.83it/s]
     average     deviation  min_exec  max_exec  repeat  number     ttime  context_size  warmup_time  x_name                fct
97  0.000003  1.559079e-07  0.000003  0.000003      10      50  0.000027           184     0.000013    9710  sdot_array_16_sse
98  0.000003  3.041801e-07  0.000003  0.000004      10      50  0.000032           184     0.000009    9810  sdot_array_16_sse
99  0.000003  1.373808e-07  0.000003  0.000003      10      50  0.000027           184     0.000012    9910  sdot_array_16_sse

Text(0.5, 1.0, 'Comparison of cython sdot implementations')
Total running time of the script: (0 minutes 4.770 seconds)