Note
Go to the end to download the full example code.
Measuring CUDA performance with a vector addition
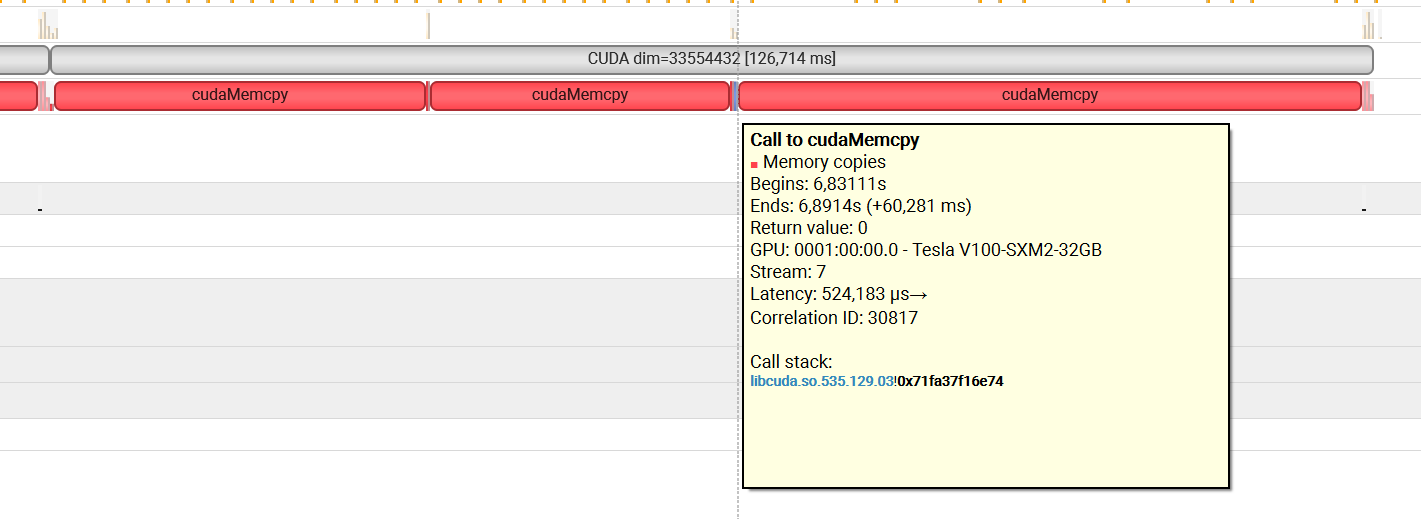
Measure the time between two additions, one with CUDA, one with numpy. The script can be profiled with Nsight.
nsys profile python _doc/examples/plot_bench_cuda_vector_add.py
Vector Add
from tqdm import tqdm
import numpy
import matplotlib.pyplot as plt
from pandas import DataFrame
from teachcompute.ext_test_case import measure_time, unit_test_going
import torch

has_cuda = torch.cuda.is_available()

try:
    from teachcompute.validation.cuda.cuda_example_py import vector_add
except ImportError:
    has_cuda = False


def cuda_vector_add(values):
    torch.cuda.nvtx.range_push(f"CUDA dim={values.size}")
    res = vector_add(values, values, 0)
    torch.cuda.nvtx.range_pop()
    return res


obs = []
dims = [2**10, 2**15, 2**20, 2**25]
if unit_test_going():
    dims = [10, 20, 30]
for dim in tqdm(dims):
    values = numpy.ones((dim,), dtype=numpy.float32).ravel()

    if has_cuda:
        diff = numpy.abs(vector_add(values, values, 0) - (values + values)).max()
        res = measure_time(lambda values=values: cuda_vector_add(values), max_time=0.5)

        obs.append(
            dict(
                dim=dim,
                size=values.size,
                time=res["average"],
                fct="CUDA",
                time_per_element=res["average"] / dim,
                diff=diff,
            )
        )

    diff = 0
    res = measure_time(lambda values=values: values + values, max_time=0.5)

    obs.append(
        dict(
            dim=dim,
            size=values.size,
            time=res["average"],
            fct="numpy",
            time_per_element=res["average"] / dim,
            diff=0,
        )
    )


df = DataFrame(obs)
piv = df.pivot(index="dim", columns="fct", values="time_per_element")
print(piv)
  0%|          | 0/4 [00:00<?, ?it/s]
 25%|██▌       | 1/4 [00:01<00:04,  1.59s/it]
 50%|█████     | 2/4 [00:02<00:02,  1.28s/it]
 75%|███████▌  | 3/4 [00:04<00:01,  1.36s/it]
100%|██████████| 4/4 [00:05<00:00,  1.53s/it]
100%|██████████| 4/4 [00:05<00:00,  1.47s/it]
fct               CUDA         numpy
dim
1024      1.298515e-06  8.808301e-10
32768     7.051319e-08  1.746531e-10
1048576   7.472719e-09  5.710179e-10
33554432  3.783167e-09  1.137362e-09
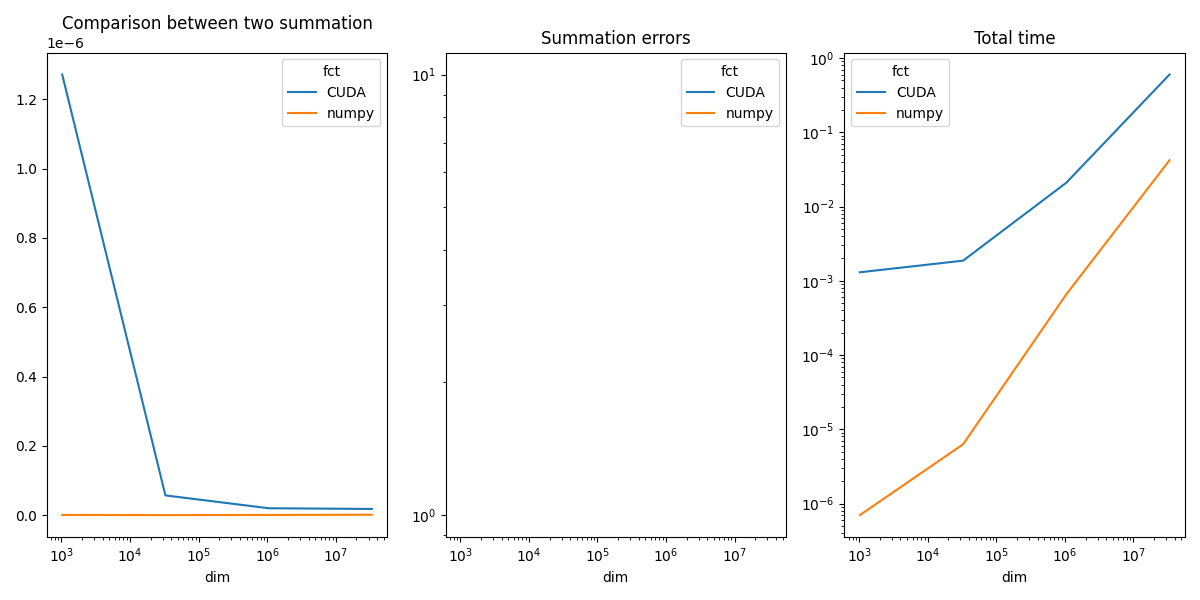
Plots
piv_diff = df.pivot(index="dim", columns="fct", values="diff")
piv_time = df.pivot(index="dim", columns="fct", values="time")

fig, ax = plt.subplots(1, 3, figsize=(12, 6))
piv.plot(ax=ax[0], logx=True, title="Comparison between two summation")
piv_diff.plot(ax=ax[1], logx=True, logy=True, title="Summation errors")
piv_time.plot(ax=ax[2], logx=True, logy=True, title="Total time")
fig.tight_layout()
fig.savefig("plot_bench_cuda_vector_add.png")
~/vv/this312/lib/python3.12/site-packages/pandas/plotting/_matplotlib/core.py:822: UserWarning: Data has no positive values, and therefore cannot be log-scaled.
  labels = axis.get_majorticklabels() + axis.get_minorticklabels()
CUDA seems very slow but in fact, all the time is spent in moving the data from the CPU memory (Host) to the GPU memory (device).
Total running time of the script: (0 minutes 10.001 seconds)