onnx_extended.plotting
onnx_extended.plotting.benchmark.hhistograms
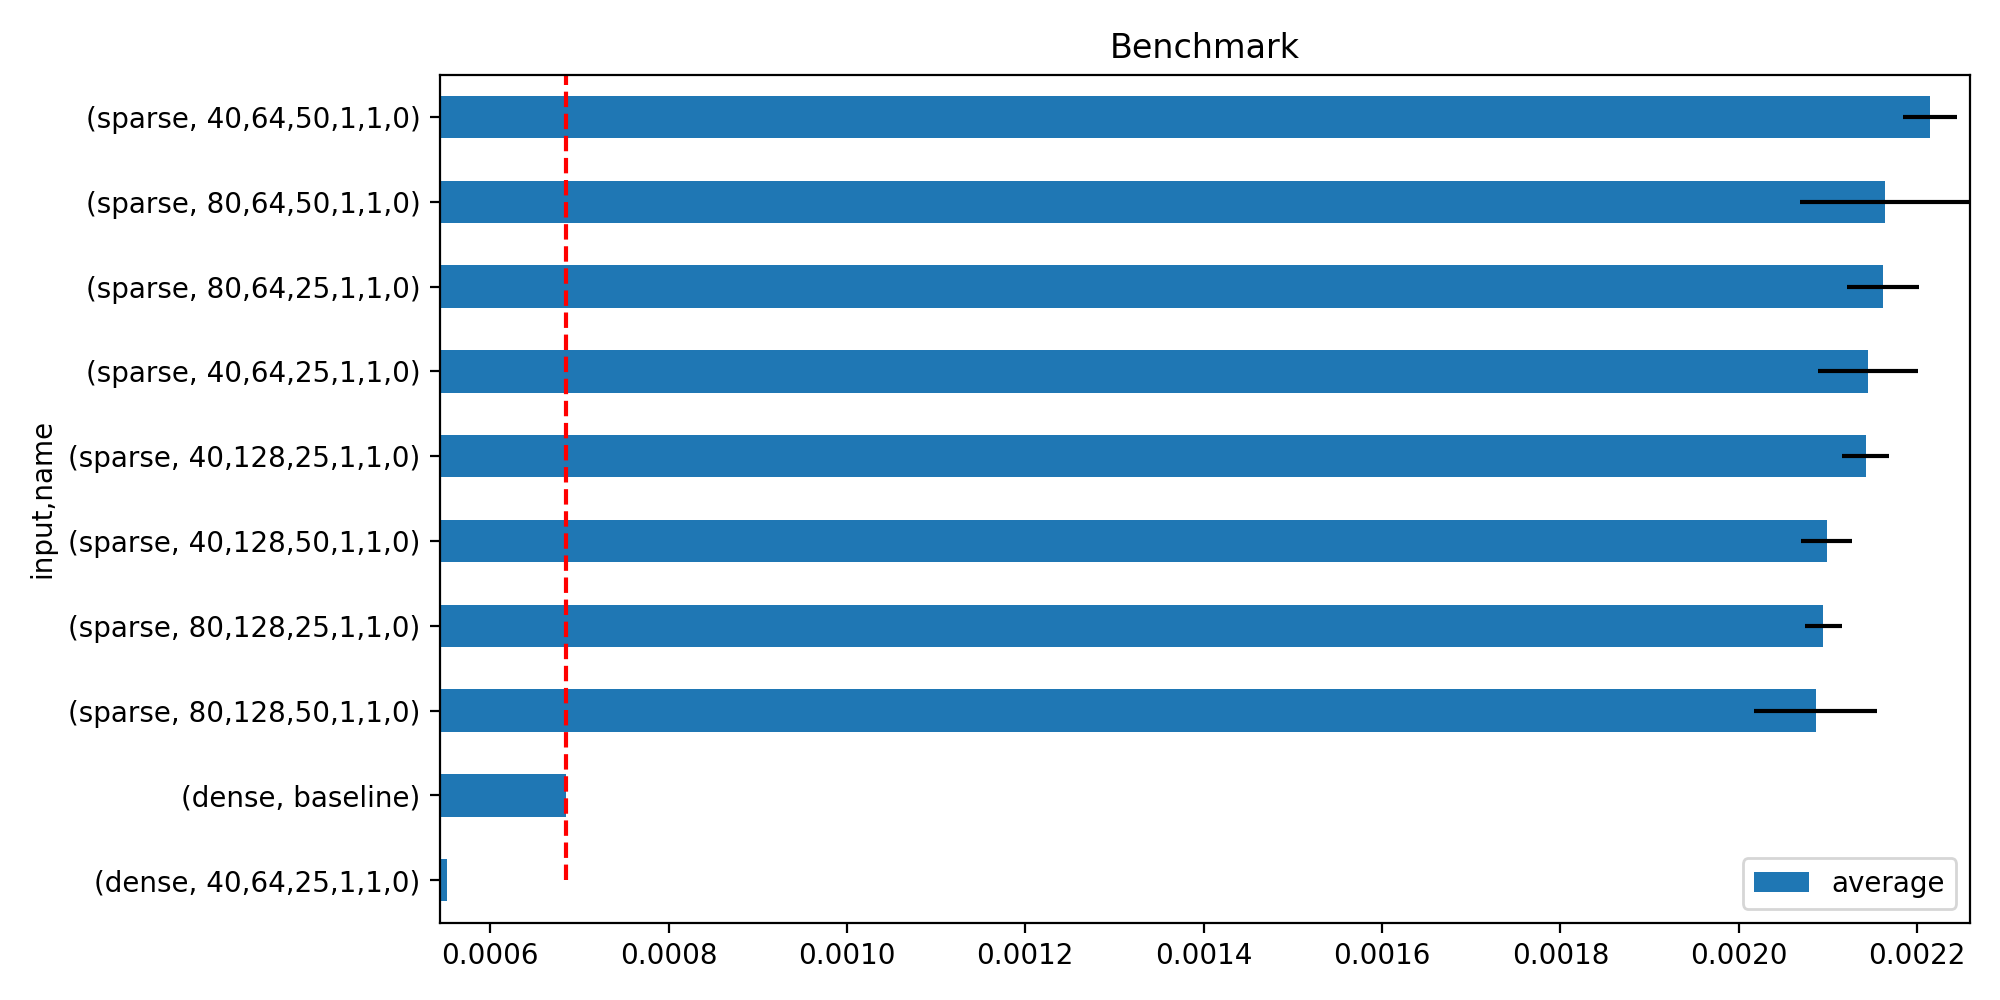
- onnx_extended.plotting.benchmark.hhistograms(df: pandas.DataFrame, keys: str | Tuple[str, ...] = 'name', metric: str = 'average', baseline: str = 'baseline', title: str = 'Benchmark', limit: int = 50, ax=None)[source]
Histograms with error bars. Shows the first best performances.
- Parameters:
df – data
keys – columns to graph by
metric – metric to display
baseline – column keys[-1], no matter what it should be displayed
title – graph title
limit – number of performances to display
ax – existing axes
- Returns:
axes
        average  deviation  min_exec  max_exec  repeat  number     ttime  context_size  warmup_time  n_exp  ...         short_name TRY             name parallel_tree  parallel_tree_N  parallel_N  batch_size_tree  batch_size_rows  use_node3   input
    0  0.002017   0.000149  0.001711  0.002174      10      10  0.020172            64     0.008852      0  ...  0,80,128,50,1,1,0 NaN  80,128,50,1,1,0          80.0            128.0        50.0              1.0              1.0        0.0  sparse
    1  0.002074   0.000065  0.001987  0.002247      10      10  0.020739            64     0.010224      1  ...  0,80,128,25,1,1,0 NaN  80,128,25,1,1,0          80.0            128.0        25.0              1.0              1.0        0.0  sparse
    2  0.002259   0.000426  0.001774  0.003436      10      10  0.022592            64     0.010841      2  ...   0,80,64,50,1,1,0 NaN   80,64,50,1,1,0          80.0             64.0        50.0              1.0              1.0        0.0  sparse
    3  0.002122   0.000065  0.002043  0.002268      10      10  0.021217            64     0.010521      3  ...   0,80,64,25,1,1,0 NaN   80,64,25,1,1,0          80.0             64.0        25.0              1.0              1.0        0.0  sparse
    4  0.002127   0.000083  0.001977  0.002236      10      10  0.021268            64     0.011336      4  ...  0,40,128,50,1,1,0 NaN  40,128,50,1,1,0          40.0            128.0        50.0              1.0              1.0        0.0  sparse

    [5 rows x 21 columns]
(
Source code,png,hires.png,pdf)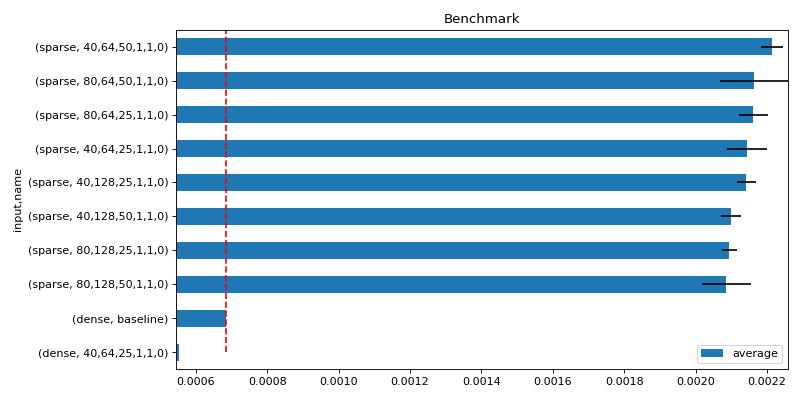
onnx_extended.plotting.benchmark.vhistograms
- onnx_extended.plotting.benchmark.vhistograms(df: pandas.DataFrame, metric: str = 'time', name: str = 'name', batch_size: str = 'batch_size', voc_size: str = 'voc_size', sup_title: str = 'Compares Implementations of TfIdfVectorizer')[source]
Histograms with error bars.
- Parameters:
df – data
metric – metric to show
name – experiment name
batch_size – first column for the variations
voc_size – second column for the variations
sup_title – figure title
- Returns:
axes
        average     deviation  min_exec  max_exec  repeat   number     ttime  context_size  warmup_time    peak    name  voc_size  batch_size      time
    0  0.000016  1.739738e-06  0.000015  0.000029       1  82641.0  1.329596            64     0.000086  172032  sparse       100           1  0.000016
    1  0.000013  8.758799e-07  0.000012  0.000018       1  89083.0  1.163168            64     0.000080   16384     ref       100           1  0.000013
    2  0.000013  3.734642e-07  0.000013  0.000021       1  80807.0  1.062602            64     0.000097    4096  custom       100           1  0.000013
    3  0.000051  1.242146e-05  0.000033  0.000060       1  29124.0  1.477159            64     0.000120   12288  sparse       100          10  0.000051
    4  0.000024  2.685157e-06  0.000021  0.000060       1  47427.0  1.153669            64     0.000356    4096     ref       100          10  0.000024
(
Source code,png,hires.png,pdf)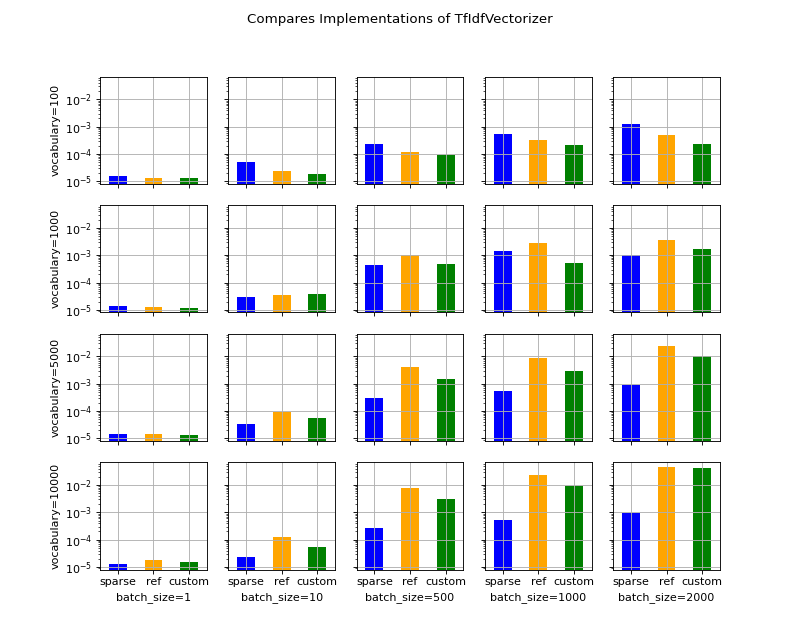