Note
Go to the end to download the full example code.
Measuring performance of TfIdfVectorizer
The banchmark measures the performance of a TfIdfVectizer along two parameters, the vocabulary size, the batch size whether. It measures the benefit of using sparse implementation through the computation time and the memory peak.
A simple model
We start with a model including only one node TfIdfVectorizer. It only contains unigram. The model processes only sequences of 10 integers. The sparsity of the results is then 10 divided by the size of vocabulary.
import gc
import time
import itertools
from typing import Tuple
import numpy as np
import pandas
from onnx import ModelProto
from onnx.helper import make_attribute
from tqdm import tqdm
from onnxruntime import InferenceSession, SessionOptions
from onnx_extended.ext_test_case import measure_time, unit_test_going
from onnx_extended.memory_peak import start_spying_on
from onnx_extended.reference import CReferenceEvaluator
from onnx_extended.ortops.optim.cpu import get_ort_ext_libs
from onnx_extended.plotting.benchmark import vhistograms


def make_onnx(n_words: int) -> ModelProto:
    from skl2onnx.common.data_types import Int64TensorType, FloatTensorType
    from skl2onnx.algebra.onnx_ops import OnnxTfIdfVectorizer

    # from onnx_array_api.light_api import start
    # onx = (
    #     start(opset=19, opsets={"ai.onnx.ml": 3})
    #     .vin("X", elem_type=TensorProto.INT64)
    #     .ai.onnx.TfIdfVectorizer(
    #     ...
    #     )
    #     .rename(Y)
    #     .vout(elem_type=TensorProto.FLOAT)
    #     .to_onnx()
    # )
    onx = OnnxTfIdfVectorizer(
        "X",
        mode="TF",
        min_gram_length=1,
        max_gram_length=1,
        max_skip_count=0,
        ngram_counts=[0],
        ngram_indexes=np.arange(n_words).tolist(),
        pool_int64s=np.arange(n_words).tolist(),
        output_names=["Y"],
    ).to_onnx(inputs=[("X", Int64TensorType())], outputs=[("Y", FloatTensorType())])
    #     .rename(Y)
    #     .vout(elem_type=TensorProto.FLOAT)
    #     .to_onnx()
    # )
    return onx


onx = make_onnx(7)
ref = CReferenceEvaluator(onx)
got = ref.run(None, {"X": np.array([[0, 1], [2, 3]], dtype=np.int64)})
print(got)
[array([[1., 1., 0., 0., 0., 0., 0.],
       [0., 0., 1., 1., 0., 0., 0.]], dtype=float32)]
It works as expected. Let’s now compare the execution with onnxruntime for different batch size and vocabulary size.
Benchmark
def make_sessions(
    onx: ModelProto,
) -> Tuple[InferenceSession, InferenceSession, InferenceSession]:
    # first: onnxruntime
    ref = InferenceSession(onx.SerializeToString(), providers=["CPUExecutionProvider"])

    # second: custom kernel equivalent to the onnxruntime implementation
    for node in onx.graph.node:
        if node.op_type == "TfIdfVectorizer":
            node.domain = "onnx_extended.ortops.optim.cpu"
            # new_add = make_attribute("sparse", 1)
            # node.attribute.append(new_add)

    d = onx.opset_import.add()
    d.domain = "onnx_extended.ortops.optim.cpu"
    d.version = 1

    r = get_ort_ext_libs()
    opts = SessionOptions()
    opts.register_custom_ops_library(r[0])
    cus = InferenceSession(
        onx.SerializeToString(), opts, providers=["CPUExecutionProvider"]
    )

    # third: with sparse
    for node in onx.graph.node:
        if node.op_type == "TfIdfVectorizer":
            new_add = make_attribute("sparse", 1)
            node.attribute.append(new_add)
    cussp = InferenceSession(
        onx.SerializeToString(), opts, providers=["CPUExecutionProvider"]
    )

    return ref, cus, cussp


if unit_test_going():
    vocabulary_sizes = [10, 20]
    batch_sizes = [5, 10]
else:
    vocabulary_sizes = [100, 1000, 5000, 10000]
    batch_sizes = [1, 10, 500, 1000, 2000]
confs = list(itertools.product(vocabulary_sizes, batch_sizes))

data = []
for voc_size, batch_size in tqdm(confs):
    onx = make_onnx(voc_size)
    ref, cus, sparse = make_sessions(onx)
    gc.collect()

    feeds = dict(
        X=(np.arange(batch_size * 10) % voc_size)
        .reshape((batch_size, -1))
        .astype(np.int64)
    )

    # sparse
    p = start_spying_on(delay=0.0001)
    sparse.run(None, feeds)
    obs = measure_time(
        lambda sparse=sparse, feeds=feeds: sparse.run(None, feeds), max_time=1
    )
    mem = p.stop()
    obs["peak"] = mem["cpu"].max_peak - mem["cpu"].begin
    obs["name"] = "sparse"
    obs.update(dict(voc_size=voc_size, batch_size=batch_size))
    data.append(obs)
    time.sleep(0.1)

    # reference
    p = start_spying_on(delay=0.0001)
    ref.run(None, feeds)
    obs = measure_time(lambda ref=ref, feeds=feeds: ref.run(None, feeds), max_time=1)
    mem = p.stop()
    obs["peak"] = mem["cpu"].max_peak - mem["cpu"].begin
    obs["name"] = "ref"
    obs.update(dict(voc_size=voc_size, batch_size=batch_size))
    data.append(obs)
    time.sleep(0.1)

    # custom
    p = start_spying_on(delay=0.0001)
    cus.run(None, feeds)
    obs = measure_time(lambda cus=cus, feeds=feeds: cus.run(None, feeds), max_time=1)
    mem = p.stop()
    obs["peak"] = mem["cpu"].max_peak - mem["cpu"].begin
    obs["name"] = "custom"
    obs.update(dict(voc_size=voc_size, batch_size=batch_size))
    data.append(obs)
    time.sleep(0.1)

    del sparse
    del cus
    del ref
    del feeds

df = pandas.DataFrame(data)
df["time"] = df["average"]
df.to_csv("plot_op_tfidfvectorizer_sparse.csv", index=False)
print(df.head())
  0%|          | 0/20 [00:00<?, ?it/s]
  5%|▌         | 1/20 [00:04<01:27,  4.60s/it]
 10%|█         | 2/20 [00:09<01:27,  4.88s/it]
 15%|█▌        | 3/20 [00:14<01:19,  4.70s/it]
 20%|██        | 4/20 [00:18<01:12,  4.55s/it]
 25%|██▌       | 5/20 [00:22<01:07,  4.52s/it]
 30%|███       | 6/20 [00:27<01:02,  4.50s/it]
 35%|███▌      | 7/20 [00:31<00:57,  4.42s/it]
 40%|████      | 8/20 [00:36<00:53,  4.42s/it]
 45%|████▌     | 9/20 [00:40<00:48,  4.42s/it]
 50%|█████     | 10/20 [00:45<00:46,  4.61s/it]
 55%|█████▌    | 11/20 [00:49<00:41,  4.56s/it]
 60%|██████    | 12/20 [00:54<00:36,  4.54s/it]
 65%|██████▌   | 13/20 [00:58<00:31,  4.51s/it]
 70%|███████   | 14/20 [01:03<00:27,  4.59s/it]
 75%|███████▌  | 15/20 [01:08<00:22,  4.56s/it]
 80%|████████  | 16/20 [01:12<00:18,  4.51s/it]
 85%|████████▌ | 17/20 [01:17<00:13,  4.61s/it]
 90%|█████████ | 18/20 [01:22<00:09,  4.62s/it]
 95%|█████████▌| 19/20 [01:26<00:04,  4.65s/it]
100%|██████████| 20/20 [01:31<00:00,  4.67s/it]
100%|██████████| 20/20 [01:31<00:00,  4.58s/it]
    average     deviation  min_exec  max_exec  repeat    number     ttime  context_size  warmup_time  peak    name  voc_size  batch_size      time
0  0.000006  1.487583e-07  0.000006  0.000023       1  176970.0  1.028938            64     0.000154     0  sparse       100           1  0.000006
1  0.000004  4.768060e-08  0.000004  0.000025       1  223647.0  1.002682            64     0.000056     0     ref       100           1  0.000004
2  0.000005  3.214319e-07  0.000005  0.000039       1  206718.0  1.119489            64     0.000079     0  custom       100           1  0.000005
3  0.000012  9.643617e-07  0.000011  0.000026       1  115011.0  1.356900            64     0.000068     0  sparse       100          10  0.000012
4  0.000016  1.573561e-06  0.000014  0.000041       1   74085.0  1.166589            64     0.000334     0     ref       100          10  0.000016
Processing time
piv = pandas.pivot_table(
    df, index=["voc_size", "name"], columns="batch_size", values="average"
)
print(piv)
batch_size           1         10        500       1000      2000
voc_size name
100      custom  0.000005  0.000007  0.000019  0.000030  0.000044
         ref     0.000004  0.000016  0.000022  0.000029  0.000044
         sparse  0.000006  0.000012  0.000153  0.000252  0.000378
1000     custom  0.000005  0.000006  0.000038  0.000073  0.000148
         ref     0.000004  0.000012  0.000030  0.000044  0.000093
         sparse  0.000006  0.000012  0.000131  0.000258  0.000372
5000     custom  0.000005  0.000009  0.000140  0.000293  0.000927
         ref     0.000005  0.000013  0.000093  0.000211  0.000788
         sparse  0.000006  0.000011  0.000129  0.000222  0.000373
10000    custom  0.000005  0.000014  0.000267  0.000957  0.002205
         ref     0.000005  0.000014  0.000231  0.000800  0.001975
         sparse  0.000006  0.000012  0.000172  0.000223  0.000397
Memory peak
It is always difficult to estimate. A second process is started to measure the physical memory peak during the execution every ms. The figures is the difference between this peak and the memory when the measurement began.
piv = pandas.pivot_table(
    df, index=["voc_size", "name"], columns="batch_size", values="peak"
)
print(piv / 2**20)
batch_size          1        10       500       1000      2000
voc_size name
100      custom  0.00000  0.00000   0.0000   0.00000   0.00000
         ref     0.00000  0.00000   0.0000   0.00000   0.00000
         sparse  0.00000  0.00000   0.0000   0.15625   0.00000
1000     custom  0.00000  0.00000   0.0000   0.00000   0.00000
         ref     0.00000  0.00000   0.0000   0.00000   0.15625
         sparse  0.15625  0.15625   0.0000   0.00000   0.15625
5000     custom  0.00000  0.00000   0.0000  19.21875  37.81250
         ref     0.00000  0.00000   0.0000  19.06250  37.96875
         sparse  0.00000  0.00000   0.0000   0.00000   0.15625
10000    custom  0.00000  0.00000  19.0625  37.96875  76.25000
         ref     0.00000  0.00000   0.0000  38.43750  76.40625
         sparse  0.00000  0.00000   0.0000   0.15625   0.00000
Graphs
ax = vhistograms(df)
fig = ax[0, 0].get_figure()
fig.savefig("plot_op_tfidfvectorizer_sparse.png")
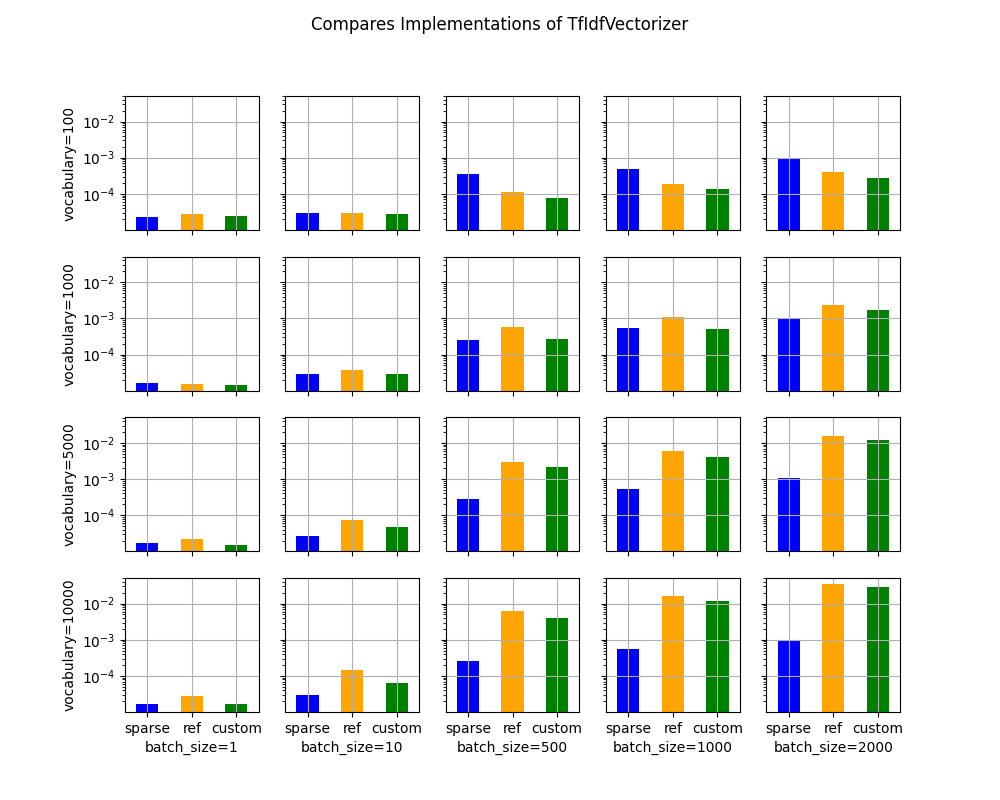
Take away
Sparse works better when the sparsity is big enough and the batch size as well.
Total running time of the script: (1 minutes 35.079 seconds)