Note
Go to the end to download the full example code
KMeans with norm L1#
This demonstrates how results change when using norm L1 for a k-means algorithm.
import matplotlib.pyplot as plt
import numpy
import numpy.random as rnd
from sklearn.cluster import KMeans
from mlinsights.mlmodel import KMeansL1L2
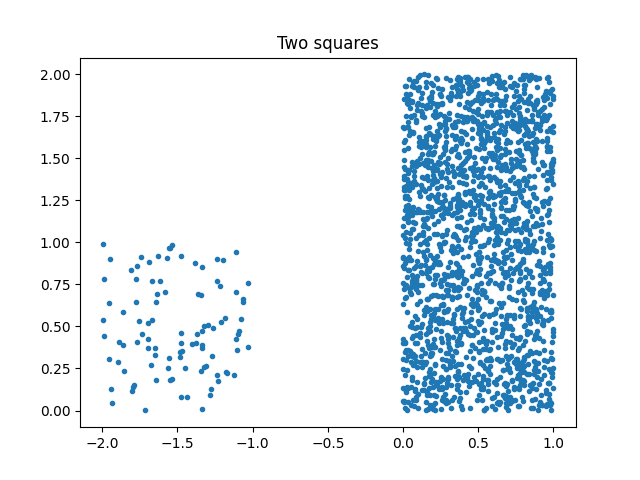
Simple datasets#
(2000, 2)
fig, ax = plt.subplots(1, 1)
ax.plot(X[:, 0], X[:, 1], ".")
ax.set_title("Two squares")

Text(0.5, 1.0, 'Two squares')
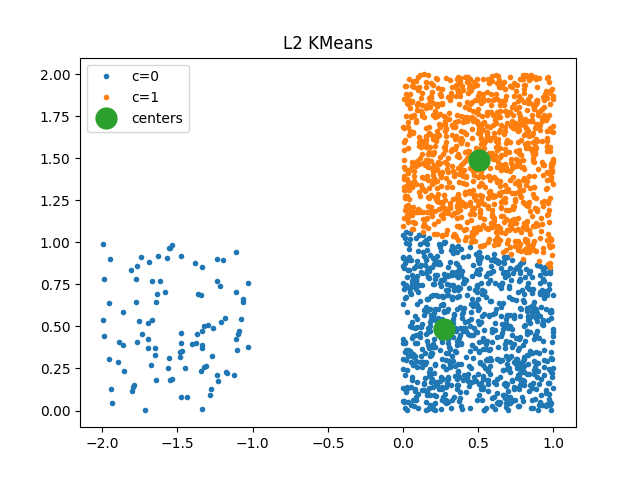
Classic KMeans#
It uses euclidean distance.
km = KMeans(2)
km.fit(X)

km.cluster_centers_


def plot_clusters(km_, X, ax):
    lab = km_.predict(X)
    for i in range(km_.cluster_centers_.shape[0]):
        sub = X[lab == i]
        ax.plot(sub[:, 0], sub[:, 1], ".", label="c=%d" % i)
    C = km_.cluster_centers_
    ax.plot(C[:, 0], C[:, 1], "o", ms=15, label="centers")
    ax.legend()


fig, ax = plt.subplots(1, 1)
plot_clusters(km, X, ax)
ax.set_title("L2 KMeans")

~/install/scikit-learn/sklearn/cluster/_kmeans.py:1416: FutureWarning: The default value of `n_init` will change from 10 to 'auto' in 1.4. Set the value of `n_init` explicitly to suppress the warning
  super()._check_params_vs_input(X, default_n_init=10)

Text(0.5, 1.0, 'L2 KMeans')
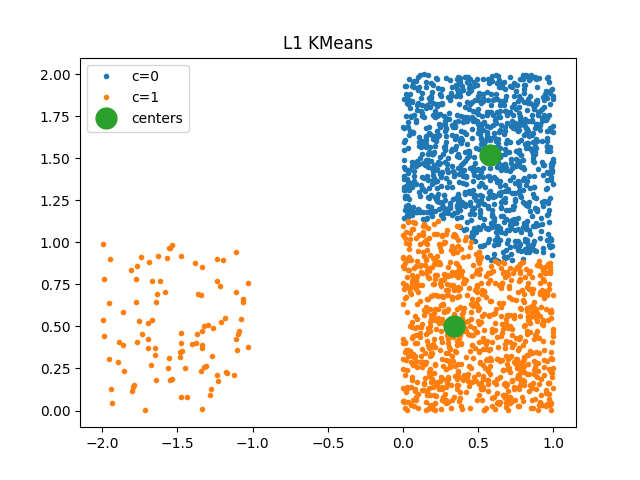
KMeans with L1 norm#
kml1 = KMeansL1L2(2, norm="L1")
kml1.fit(X)
array([[0.58108112, 1.52162673],
       [0.33950775, 0.5016112 ]])
fig, ax = plt.subplots(1, 1)
plot_clusters(kml1, X, ax)
ax.set_title("L1 KMeans")

Text(0.5, 1.0, 'L1 KMeans')
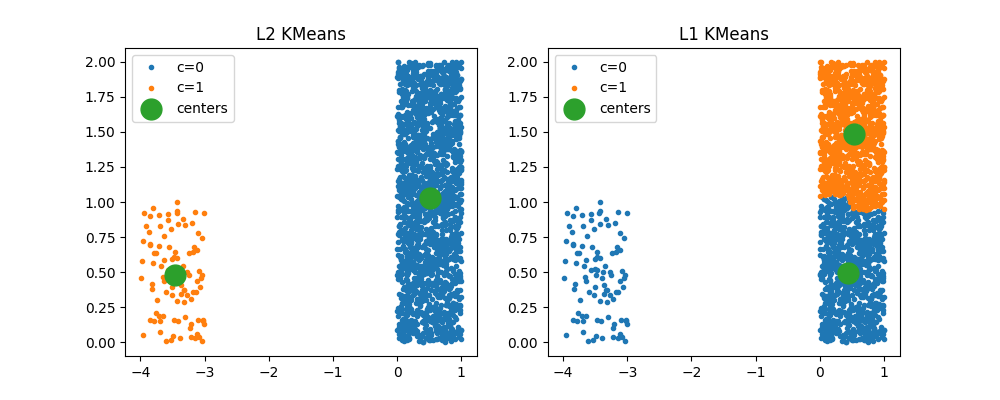
When clusters are completely different#
(2000, 2)
~/install/scikit-learn/sklearn/cluster/_kmeans.py:1416: FutureWarning: The default value of `n_init` will change from 10 to 'auto' in 1.4. Set the value of `n_init` explicitly to suppress the warning
  super()._check_params_vs_input(X, default_n_init=10)
kml1 = KMeansL1L2(2, norm="L1")
kml1.fit(X)

Text(0.5, 1.0, 'L1 KMeans')
Total running time of the script: (0 minutes 3.709 seconds)