Note
Click here to download the full example code
Measuring onnxruntime performance#
The following code measures the performance of the python bindings. The time spent in it is not significant when the computation is huge but it may be for small matrices.
A simple onnx model#
import numpy
from pandas import DataFrame
import matplotlib.pyplot as plt
from tqdm import tqdm
from onnx import numpy_helper, TensorProto
from onnx.helper import (
    make_model,
    make_node,
    make_graph,
    make_tensor_value_info,
    make_opsetid,
)
from onnx.checker import check_model
from onnxruntime import InferenceSession
from onnx_extended.ortcy.wrap.ortinf import OrtSession
from onnx_extended.ext_test_case import measure_time, unit_test_going

A = numpy_helper.from_array(numpy.array([1], dtype=numpy.float32), name="A")
X = make_tensor_value_info("X", TensorProto.FLOAT, [None, None])
Y = make_tensor_value_info("Y", TensorProto.FLOAT, [None, None])
node1 = make_node("Add", ["X", "A"], ["Y"])
graph = make_graph([node1], "+1", [X], [Y], [A])
onnx_model = make_model(graph, opset_imports=[make_opsetid("", 18)], ir_version=8)
check_model(onnx_model)
Two python bindings on CPU#
sess_ort = InferenceSession(
    onnx_model.SerializeToString(), providers=["CPUExecutionProvider"]
)
sess_ext = OrtSession(onnx_model.SerializeToString())

x = numpy.random.randn(10, 10).astype(numpy.float32)
y = x + 1

y_ort = sess_ort.run(None, {"X": x})[0]
y_ext = sess_ext.run([x])[0]

d_ort = numpy.abs(y_ort - y).sum()
d_ext = numpy.abs(y_ext - y).sum()
print(f"Discrepancies: d_ort={d_ort}, d_ext={d_ext}")
Discrepancies: d_ort=0.0, d_ext=0.0
Time measurement#
run_1_1 is a specific implementation when there is only 1 input and output.
t_ort = measure_time(lambda: sess_ort.run(None, {"X": x})[0], number=200, repeat=100)
print(f"t_ort={t_ort}")

t_ext = measure_time(lambda: sess_ext.run([x])[0], number=200, repeat=100)
print(f"t_ext={t_ext}")

t_ext2 = measure_time(lambda: sess_ext.run_1_1(x), number=200, repeat=100)
print(f"t_ext2={t_ext2}")
t_ort={'average': 1.467072404921055e-05, 'deviation': 5.178767749236388e-06, 'min_exec': 9.706670007290085e-06, 'max_exec': 3.80450450029457e-05, 'repeat': 100, 'number': 200, 'ttime': 0.001467072404921055, 'context_size': 64}
t_ext={'average': 2.2105248499974554e-05, 'deviation': 9.045250873399251e-06, 'min_exec': 1.0917295003309847e-05, 'max_exec': 7.093342501320876e-05, 'repeat': 100, 'number': 200, 'ttime': 0.0022105248499974554, 'context_size': 64}
t_ext2={'average': 1.5214418450523225e-05, 'deviation': 4.461332318917484e-06, 'min_exec': 9.289045010518748e-06, 'max_exec': 3.208563499356387e-05, 'repeat': 100, 'number': 200, 'ttime': 0.0015214418450523225, 'context_size': 64}
Benchmark#
data = []
for dim in tqdm([1, 10, 100, 1000]):
    if dim < 1000:
        number, repeat = 100, 50
    else:
        number, repeat = 20, 10
    x = numpy.random.randn(dim, dim).astype(numpy.float32)
    t_ort = measure_time(
        lambda: sess_ort.run(None, {"X": x})[0], number=number, repeat=50
    )
    t_ort["name"] = "ort"
    t_ort["dim"] = dim
    data.append(t_ort)

    t_ext = measure_time(lambda: sess_ext.run([x])[0], number=number, repeat=repeat)
    t_ext["name"] = "ext"
    t_ext["dim"] = dim
    data.append(t_ext)

    t_ext2 = measure_time(lambda: sess_ext.run_1_1(x), number=number, repeat=repeat)
    t_ext2["name"] = "ext_1_1"
    t_ext2["dim"] = dim
    data.append(t_ext2)

    if unit_test_going() and dim >= 10:
        break


df = DataFrame(data)
df
  0%|          | 0/4 [00:00<?, ?it/s]
 25%|##5       | 1/4 [00:00<00:00,  3.55it/s]
 50%|#####     | 2/4 [00:00<00:00,  3.60it/s]
 75%|#######5  | 3/4 [00:00<00:00,  2.88it/s]
100%|##########| 4/4 [00:02<00:00,  1.10it/s]
100%|##########| 4/4 [00:02<00:00,  1.45it/s]
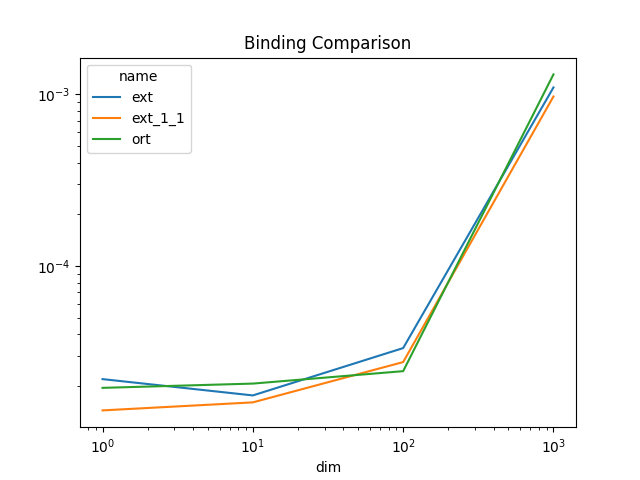
Plots#
piv = df.pivot(index="dim", columns="name", values="average")

fig, ax = plt.subplots(1, 1)
piv.plot(ax=ax, title="Binding Comparison", logy=True, logx=True)
fig.savefig("plot_bench_ort.png")

Total running time of the script: ( 0 minutes 10.489 seconds)