Note
Go to the end to download the full example code.
Measuring CPU performance
Processor caches must be taken into account when writing an algorithm, see Memory part 2: CPU caches from Ulrich Drepper.
Cache Performance
Code of benchmark_cache.
obs = []
step = 2**12
for i in tqdm(range(step, 2**20 + step, step)):
    res = min(
        [
            benchmark_cache(i, False),
            benchmark_cache(i, False),
            benchmark_cache(i, False),
        ]
    )
    if res < 0:
        # overflow
        continue
    obs.append(dict(size=i, perf=res))

df = DataFrame(obs)
mean = df.perf.mean()
lag = 32
for i in range(2, df.shape[0]):
    df.loc[i, "smooth"] = df.loc[i - 8 : i + 8, "perf"].median()
    if i > lag and i < df.shape[0] - lag:
        df.loc[i, "delta"] = (
            mean
            + df.loc[i : i + lag, "perf"].mean()
            - df.loc[i - lag + 1 : i + 1, "perf"]
        ).mean()
  0%|          | 0/256 [00:00<?, ?it/s]
 50%|████▉     | 127/256 [00:00<00:00, 1269.83it/s]
 99%|█████████▉| 254/256 [00:00<00:00, 744.94it/s]
100%|██████████| 256/256 [00:00<00:00, 788.15it/s]
Cache size estimator
cache_size_index = int(df.delta.argmax())
cache_size = df.loc[cache_size_index, "size"] * 2
print(f"L2 cache size estimation is {cache_size / 2 ** 20:1.3f} Mb.")
L2 cache size estimation is 0.266 Mb.
Verification
try:
    out, err = run_cmd("lscpu", wait=True)
    print("\n".join(_ for _ in out.split("\n") if "cache:" in _))
except Exception as e:
    print(f"failed due to {e}")

df = df.set_index("size")
fig, ax = plt.subplots(1, 1, figsize=(12, 4))
df.plot(ax=ax, title="Cache Performance time/size", logy=True)
fig.tight_layout()
fig.savefig("plot_benchmark_cpu_array.png")
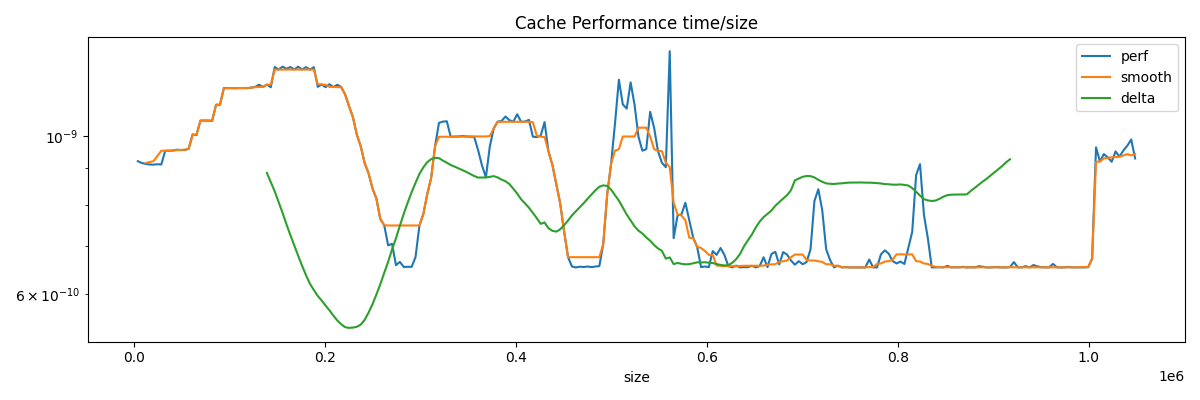
L1d cache:                            480 KiB (10 instances)
L1i cache:                            320 KiB (10 instances)
L2 cache:                             12.5 MiB (10 instances)
L3 cache:                             24 MiB (1 instance)
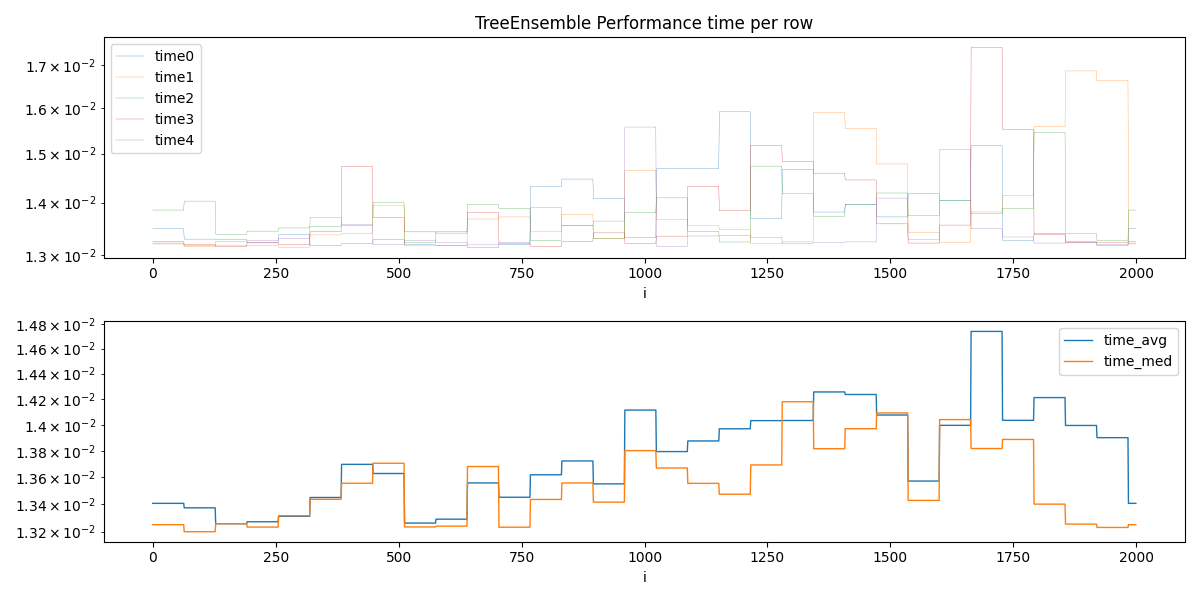
TreeEnsemble Performance
We simulate the computation of a TreeEnsemble
of 50 features, 100 trees and depth of 10
(so  nodes.)
The code of benchmark_cache_tree
nodes.)
The code of benchmark_cache_tree
dfs = []
cols = []
drop = []
for n in tqdm(range(2 if unit_test_going() else 5)):
    res = benchmark_cache_tree(
        n_rows=2000,
        n_features=50,
        n_trees=100,
        tree_size=1024,
        max_depth=10,
        search_step=64,
    )
    res = [[max(r.row, i), r.time] for i, r in enumerate(res)]
    df = DataFrame(res)
    df.columns = [f"i{n}", f"time{n}"]
    dfs.append(df)
    cols.append(df.columns[-1])
    drop.append(df.columns[0])

df = concat(dfs, axis=1).reset_index(drop=True)
df["i"] = df["i0"]
df = df.drop(drop, axis=1)
df["time_avg"] = df[cols].mean(axis=1)
df["time_med"] = df[cols].median(axis=1)

df.head()
  0%|          | 0/5 [00:00<?, ?it/s]
 20%|██        | 1/5 [00:00<00:01,  2.40it/s]
 40%|████      | 2/5 [00:00<00:01,  2.48it/s]
 60%|██████    | 3/5 [00:01<00:00,  2.50it/s]
 80%|████████  | 4/5 [00:01<00:00,  2.50it/s]
100%|██████████| 5/5 [00:01<00:00,  2.52it/s]
100%|██████████| 5/5 [00:01<00:00,  2.50it/s]
Estimation
Optimal batch size is among:
      i  time_med  time_avg
0  1664  0.012523  0.012530
1   256  0.012525  0.012540
2  1344  0.012532  0.012811
3   448  0.012532  0.012601
4   384  0.012534  0.012563
5  1024  0.012539  0.012536
6   896  0.012541  0.012561
7  1856  0.012545  0.012842
8   576  0.012545  0.012566
9   320  0.012545  0.013708
One possible estimation
Estimation: 957.8479130555965
Plots.
cols_time = ["time_avg", "time_med"]
fig, ax = plt.subplots(2, 1, figsize=(12, 6))
df.set_index("i").drop(cols_time, axis=1).plot(
    ax=ax[0], title="TreeEnsemble Performance time per row", logy=True, linewidth=0.2
)
df.set_index("i")[cols_time].plot(ax=ax[1], linewidth=1.0, logy=True)
fig.tight_layout()
fig.savefig("plot_bench_cpu.png")
Total running time of the script: (0 minutes 3.702 seconds)