Note
Go to the end to download the full example code.
Measuring onnxruntime performance against a cython binding
The following code measures the performance of the python bindings against a cython binding. The time spent in it is not significant when the computation is huge but it may be for small matrices.
import numpy
from pandas import DataFrame
import matplotlib.pyplot as plt
from tqdm import tqdm
from onnx import numpy_helper, TensorProto
from onnx.helper import (
    make_model,
    make_node,
    make_graph,
    make_tensor_value_info,
    make_opsetid,
)
from onnx.checker import check_model
from onnxruntime import InferenceSession
from onnx_extended.ortcy.wrap.ortinf import OrtSession
from onnx_extended.args import get_parsed_args
from onnx_extended.ext_test_case import measure_time, unit_test_going

script_args = get_parsed_args(
    "plot_bench_cypy_ort",
    description=__doc__,
    dims=(
        "1,10" if unit_test_going() else "1,10,100,1000",
        "square matrix dimensions to try, comma separated values",
    ),
    expose="repeat,number",
)
A simple onnx model
A = numpy_helper.from_array(numpy.array([1], dtype=numpy.float32), name="A")
X = make_tensor_value_info("X", TensorProto.FLOAT, [None, None])
Y = make_tensor_value_info("Y", TensorProto.FLOAT, [None, None])
node1 = make_node("Add", ["X", "A"], ["Y"])
graph = make_graph([node1], "+1", [X], [Y], [A])
onnx_model = make_model(graph, opset_imports=[make_opsetid("", 18)], ir_version=8)
check_model(onnx_model)
Two python bindings on CPU
sess_ort = InferenceSession(
    onnx_model.SerializeToString(), providers=["CPUExecutionProvider"]
)
sess_ext = OrtSession(onnx_model.SerializeToString())

x = numpy.random.randn(10, 10).astype(numpy.float32)
y = x + 1

y_ort = sess_ort.run(None, {"X": x})[0]
y_ext = sess_ext.run([x])[0]

d_ort = numpy.abs(y_ort - y).sum()
d_ext = numpy.abs(y_ext - y).sum()
print(f"Discrepancies: d_ort={d_ort}, d_ext={d_ext}")
Discrepancies: d_ort=0.0, d_ext=0.0
Time measurement
run_1_1 is a specific implementation when there is only 1 input and output.
t_ort = measure_time(lambda: sess_ort.run(None, {"X": x})[0], number=200, repeat=100)
print(f"t_ort={t_ort}")

t_ext = measure_time(lambda: sess_ext.run([x])[0], number=200, repeat=100)
print(f"t_ext={t_ext}")

t_ext2 = measure_time(lambda: sess_ext.run_1_1(x), number=200, repeat=100)
print(f"t_ext2={t_ext2}")
t_ort={'average': np.float64(8.800695600439212e-06), 'deviation': np.float64(3.2317274547585347e-06), 'min_exec': np.float64(6.509124996227911e-06), 'max_exec': np.float64(2.5537954998071654e-05), 'repeat': 100, 'number': 200, 'ttime': np.float64(0.0008800695600439212), 'context_size': 64, 'warmup_time': 9.531000068818685e-05}
t_ext={'average': np.float64(1.142005009978675e-05), 'deviation': np.float64(6.837867590795209e-06), 'min_exec': np.float64(4.6483200003422095e-06), 'max_exec': np.float64(3.5735434994421664e-05), 'repeat': 100, 'number': 200, 'ttime': np.float64(0.001142005009978675), 'context_size': 64, 'warmup_time': 0.00010029300028691068}
t_ext2={'average': np.float64(5.685612549950747e-06), 'deviation': np.float64(1.4660172944859024e-06), 'min_exec': np.float64(3.7554049958998803e-06), 'max_exec': np.float64(7.638394999958108e-06), 'repeat': 100, 'number': 200, 'ttime': np.float64(0.0005685612549950747), 'context_size': 64, 'warmup_time': 8.761199933360331e-05}
Benchmark
dims = [int(i) for i in script_args.dims.split(",")]

data = []
for dim in tqdm(dims):
    if dim < 1000:
        number, repeat = script_args.number, script_args.repeat
    else:
        number, repeat = script_args.number * 5, script_args.repeat * 5
    x = numpy.random.randn(dim, dim).astype(numpy.float32)
    t_ort = measure_time(
        lambda x=x: sess_ort.run(None, {"X": x})[0], number=number, repeat=50
    )
    t_ort["name"] = "ort"
    t_ort["dim"] = dim
    data.append(t_ort)

    t_ext = measure_time(lambda x=x: sess_ext.run([x])[0], number=number, repeat=repeat)
    t_ext["name"] = "ext"
    t_ext["dim"] = dim
    data.append(t_ext)

    t_ext2 = measure_time(lambda x=x: sess_ext.run_1_1(x), number=number, repeat=repeat)
    t_ext2["name"] = "ext_1_1"
    t_ext2["dim"] = dim
    data.append(t_ext2)

    if unit_test_going() and dim >= 10:
        break


df = DataFrame(data)
df
  0%|          | 0/4 [00:00<?, ?it/s]
100%|██████████| 4/4 [00:02<00:00,  1.65it/s]
100%|██████████| 4/4 [00:02<00:00,  1.65it/s]
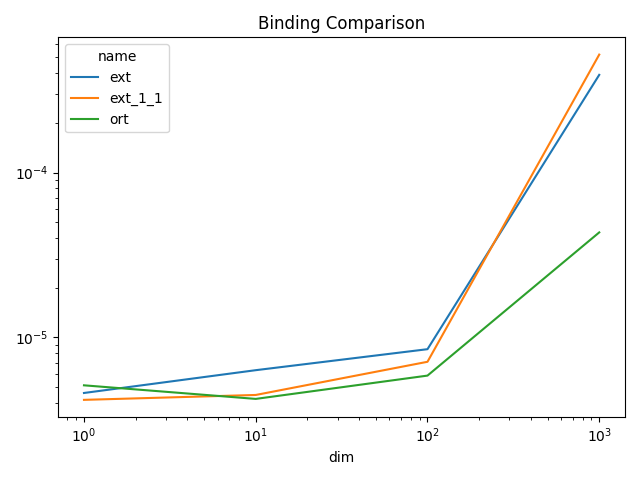
Plots
piv = df.pivot(index="dim", columns="name", values="average")

fig, ax = plt.subplots(1, 1)
piv.plot(ax=ax, title="Binding Comparison", logy=True, logx=True)
fig.tight_layout()
fig.savefig("plot_bench_ort.png")
Total running time of the script: (0 minutes 3.538 seconds)