Note
Go to the end to download the full example code.
Profiling onnxruntime execution#
This example shows how to profile the execution of an ONNX model with
onnxruntime and visualize the results with
plot_ort_profile() and
plot_ort_profile_timeline().
Build a small ONNX model#
import os
import tempfile

import numpy as np
import onnx
import onnx.helper as oh
import onnx.numpy_helper as onh

model = oh.make_model(
    oh.make_graph(
        [
            oh.make_node("MatMul", ["x", "W1"], ["h"]),
            oh.make_node("Add", ["h", "b1"], ["relu_in"]),
            oh.make_node("Relu", ["relu_in"], ["output"]),
        ],
        "test_graph",
        [oh.make_tensor_value_info("x", onnx.TensorProto.FLOAT, (2, 4))],
        [oh.make_tensor_value_info("output", onnx.TensorProto.FLOAT, (2, 8))],
        [
            onh.from_array(np.random.randn(4, 8).astype(np.float32), name="W1"),
            onh.from_array(np.zeros(8, dtype=np.float32), name="b1"),
        ],
    ),
    opset_imports=[oh.make_opsetid("", 18)],
    ir_version=8,
)
Run with onnxruntime profiling enabled#
from onnxruntime import InferenceSession, SessionOptions

tmpdir = tempfile.mkdtemp()
opts = SessionOptions()
opts.enable_profiling = True
opts.profile_file_prefix = os.path.join(tmpdir, "ort_profile")

sess = InferenceSession(
    model.SerializeToString(), sess_options=opts, providers=["CPUExecutionProvider"]
)
x = np.random.randn(2, 4).astype(np.float32)
for _ in range(5):
    sess.run(None, {"x": x})

profile_file = sess.end_profiling()
print("Profile written to:", profile_file)
Profile written to: /tmp/tmp4nk0w9wx/ort_profile_2026-05-06_10-56-11_701.json
Parse the profiling file into a DataFrame#
from yaourt.tools.js_profile import js_profile_to_dataframe

df = js_profile_to_dataframe(profile_file, first_it_out=True)
print(df[["name", "event_name", "iteration", "dur"]].head(10).to_string())
                                 name                   event_name  iteration   dur
0                 model_loading_array          model_loading_array         -1   335
1              session_initialization       session_initialization         -1  1012
2  fused /MatMulAddFusion_kernel_time                  kernel_time         -1   166
3         SequentialExecutor::Execute  SequentialExecutor::Execute          0   186
4                           model_run                    model_run          0   222
5  fused /MatMulAddFusion_kernel_time                  kernel_time          0    31
6         SequentialExecutor::Execute  SequentialExecutor::Execute          1    37
7                           model_run                    model_run          1    48
8  fused /MatMulAddFusion_kernel_time                  kernel_time          1    20
9         SequentialExecutor::Execute  SequentialExecutor::Execute          2    26
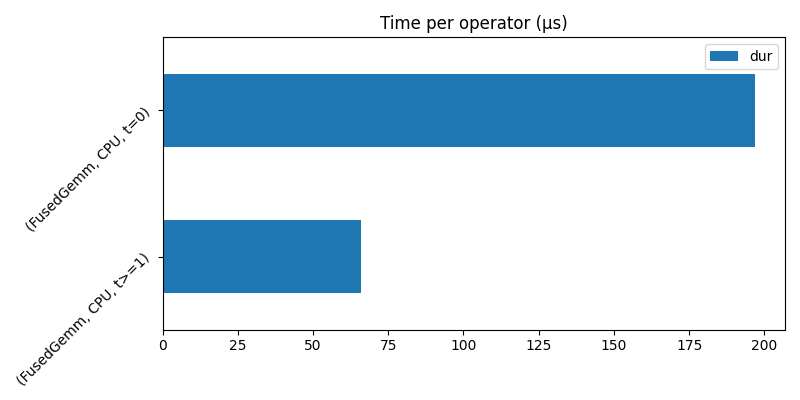
Plot a summary by operator type#
import matplotlib
import matplotlib.pyplot as plt

matplotlib.use("Agg")

from yaourt.tools.js_profile import plot_ort_profile

fig, ax = plt.subplots(figsize=(8, 4))
plot_ort_profile(df, ax0=ax, title="Time per operator (µs)")
fig.tight_layout()
fig
<Figure size 800x400 with 1 Axes>
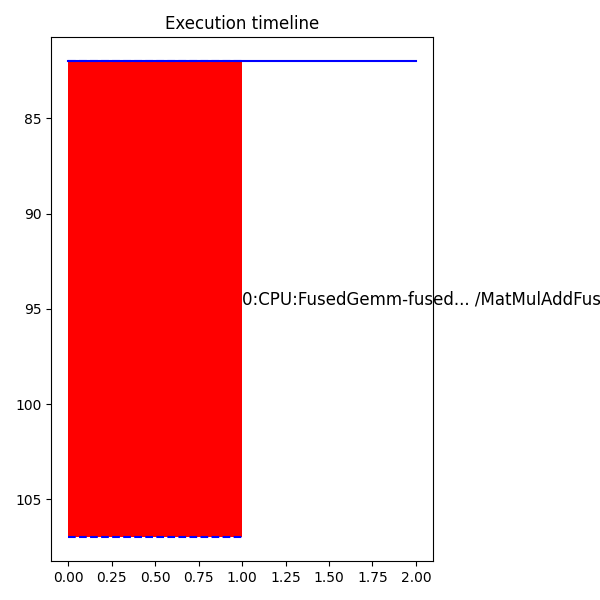
Plot the execution timeline#
from yaourt.tools.js_profile import plot_ort_profile_timeline

fig2, ax2 = plt.subplots(figsize=(6, 6))
plot_ort_profile_timeline(df, ax=ax2, title="Execution timeline")
fig2.tight_layout()
fig2
<Figure size 600x600 with 1 Axes>
Cleanup#
os.unlink(profile_file)
import shutil

shutil.rmtree(tmpdir, ignore_errors=True)
Total running time of the script: (0 minutes 0.531 seconds)