gdot
This directive displays dot graph in the documentation. It relies on Graphviz.
Usage
In conf.py:
extensions = [ ...
    'sphinx.ext.graphviz',
    'sphinx_runpython.gdot',
]
One example:
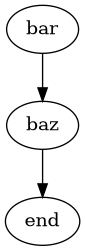
.. gdot::
    :format: png

    digraph foo {
        "bar" -> "baz" -> "end";
    }
Which gives:
The output format is an image (PNG). It can be changed to use SVG but it requires viz.js to be displayed.
.. gdot::
    :format: svg

    digraph foo {
        "bar" -> "baz" -> "svg";
    }
The graph may also be the output of a script.
.. gdot::
    :format: svg
    :script: AFTER-THIS

    print("before the graph")
    print("AFTER-THIS", """
    digraph foo {
        "bar" -> "baz" -> "script";
    }
    """)
Finally, the tag :process: can be used to run the script in a separate process.
Directive
- class sphinx_runpython.gdot.sphinx_gdot_extension.GDotDirective(name, arguments, options, content, lineno, content_offset, block_text, state, state_machine)[source]
A
gdotnode displays a DOT graph. The build choose SVG for HTML format and image for other format unless it is specified.format: SVG or HTML
- script: boolean or a string to indicate than the standard output
should only be considered after this substring
url: url to viz.js, only if format SVG is selected
process: run the script in an another process
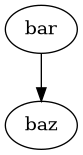
Example:
.. gdot::

    digraph foo {
        "bar" -> "baz";
    }
Which gives:
The directive also accepts scripts producing dot graphs on the standard output. Option script must be specified. This extension loads sphinx.ext.graphviz if not added to the list of extensions:
Example:
.. gdot::
    :format: png

    digraph foo {
        "bar" -> "baz";
    }
The output can be produced by a script:
.. gdot::
    :script:

    print('''
        digraph foo {
            "bar" -> "baz";
        }
    ''')
